Figure 10.6
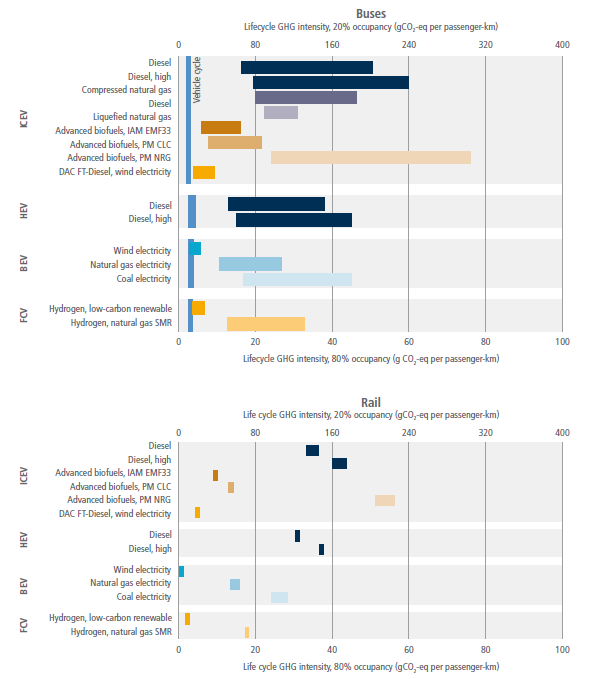
Figure caption
Figure 10.6 | Lifecycle greenhouse gas intensity of land-based bus and rail technologies. Each bar represents the range of the lifecycle estimates, bounded by minimum and maximum energy use per passenger-kilometre, as reported for each fuel/powertrain combination. The ranges are driven by differences in vehicle characteristics and operating efficiency. For energy sources with highly variable upstream emissions, low, medium and/or high representative values are shown as separate rows. The primary x-axis shows lifecycle GHG emissions, in gCO2-eq pkm–1, assuming 80% occupancy; the secondary x-axis assumes 20% occupancy. The values in the figure rely on the 100-year GWP value embedded in the source data, which may differ slightly from the updated 100-year GWP values from WGI. For buses, the main bars show full lifecycle, with vertical bars disaggregating the vehicle cycle. ‘Diesel, high’ references emissions factors for diesel from oil sands. ‘advanced biofuels’, refers to the use of second-generation biofuels and their respective conversion and cultivation emissions factors. ‘IAM EMF33’ refers to emissions factors for advanced biofuels derived from simulation results from the integrated assessment models EMF33 scenarios. ‘PM’ refers to partial models, where ‘CLC’ is with constant land cover and ‘NRG’ is with natural regrowth. ‘DAC FT-Diesel, wind electricity’ refers to Fischer-Tropsch diesel produced via a CO2 direct air capture process that uses wind electricity. ‘Hydrogen, low-carbon renewable’ refers to fuels produced via electrolysis using low-carbon electricity. ‘Hydrogen, natural gas SMR’ refers to fuels produced via steam methane reforming of natural gas. Results for ICEVs with ‘high emissions DAC FT-Diesel from natural gas’ are not included here since the lifecycle emissions are estimated to be substantially higher than petroleum diesel ICEVs.