Back to chapter figures
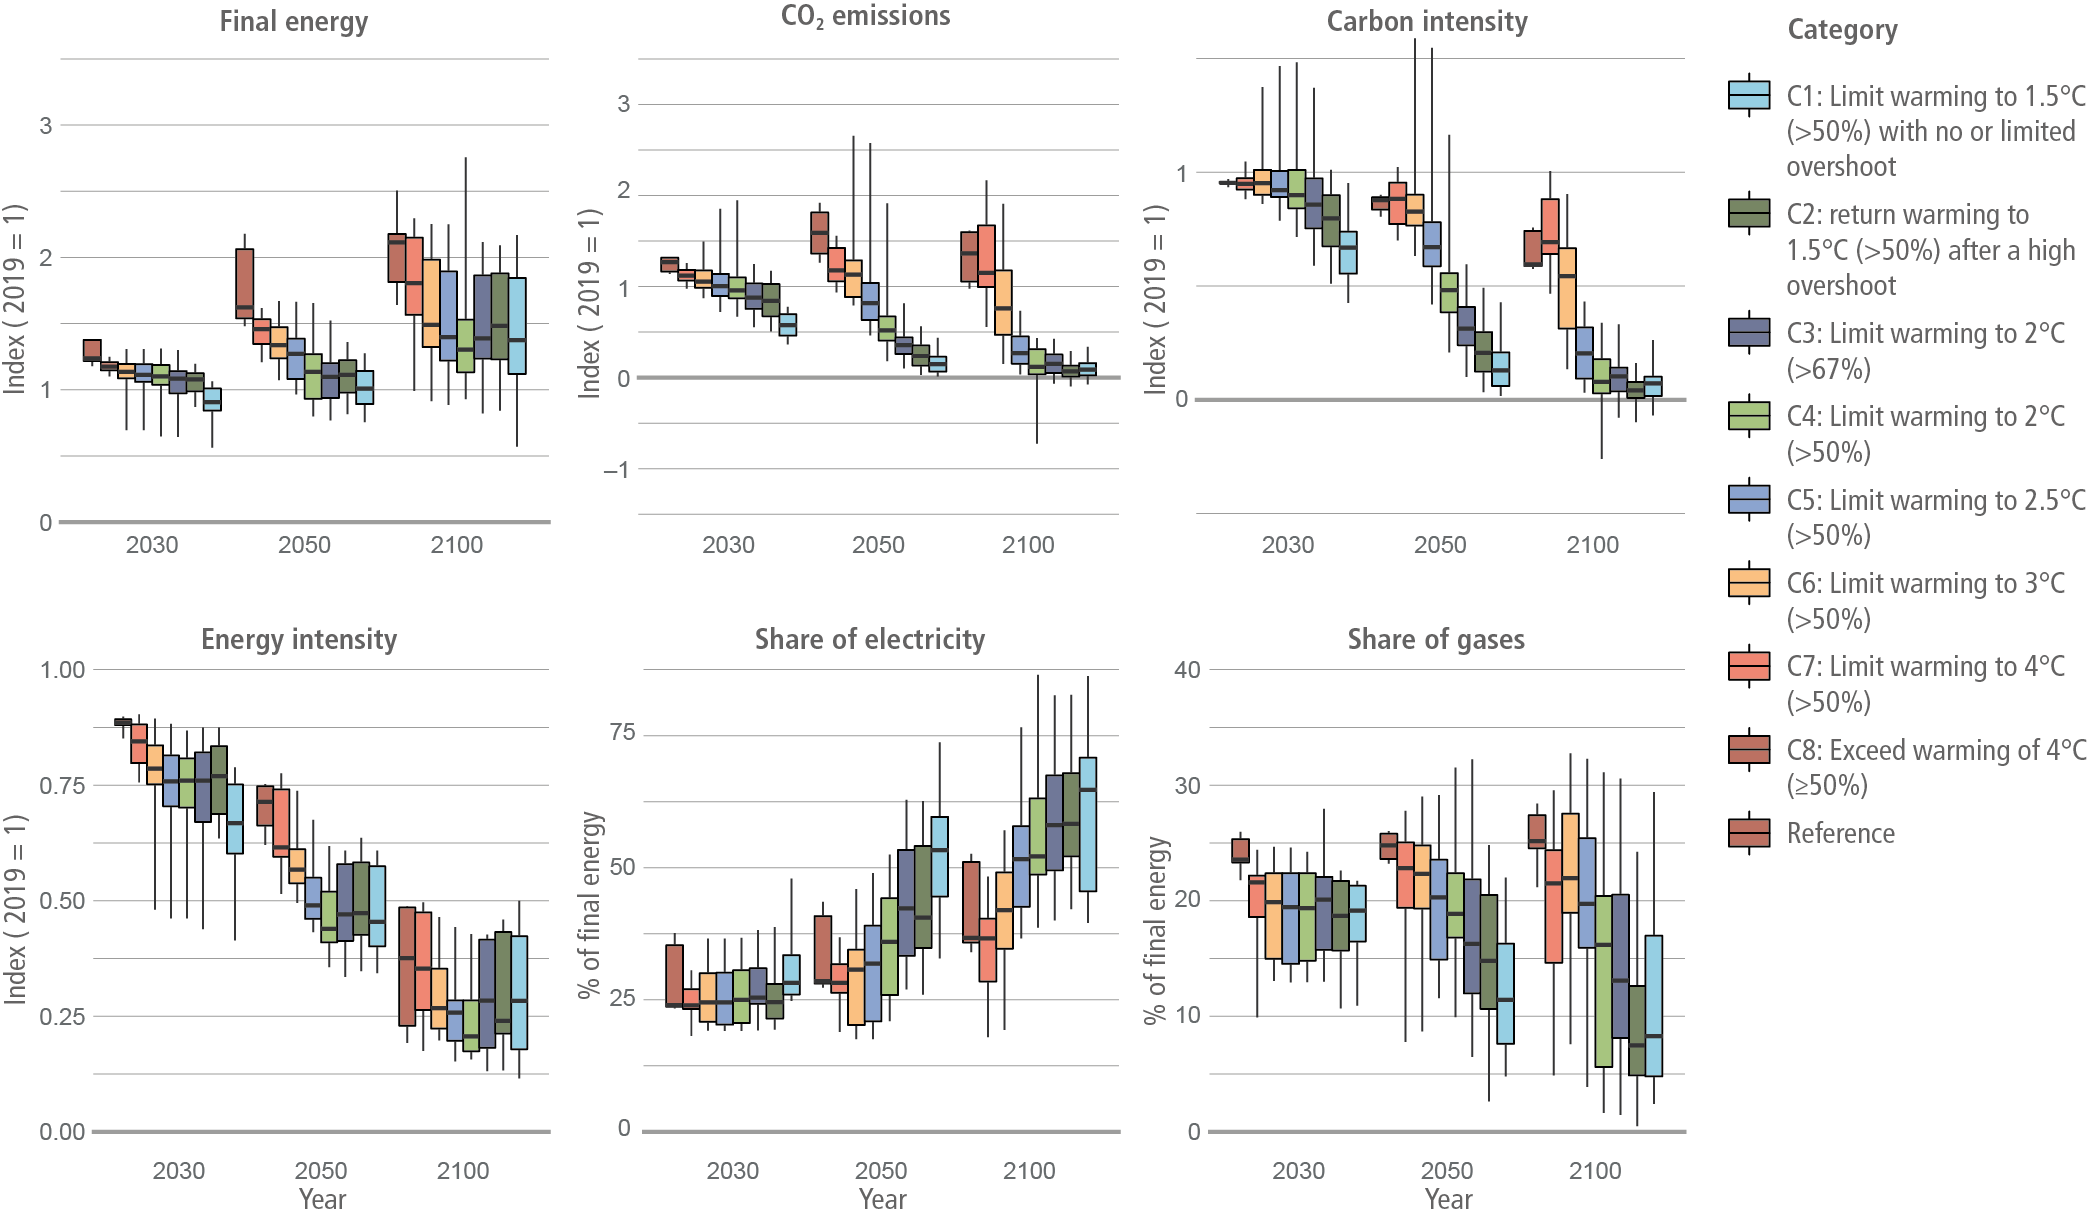
Figure 11.11 Industrial final energy (top left), CO
Figure caption
Figure 11.11 Industrial final energy (top left), CO2 emissions (top middle), energy intensity (bottom left), carbon intensity (top right), share of electricity (bottom middle), and share of gases (bottom right). Energy intensity is final energy per unit of GDP. Carbon intensity is CO2 emissions per EJ of final energy. The first four indicators are indexed to 2019, where values less than 1 indicate a reduction. Industrial-sector CO2 emissions include fuel-combustion emissions only. Boxes indicate the interquartile range, the median is shown with a horizontal black line, while vertical lines show the 5 to 95% interval. Source: data are from the AR6 database; only scenarios that pass the vetting criteria are included (Section 3.2).
