Figure 11.12
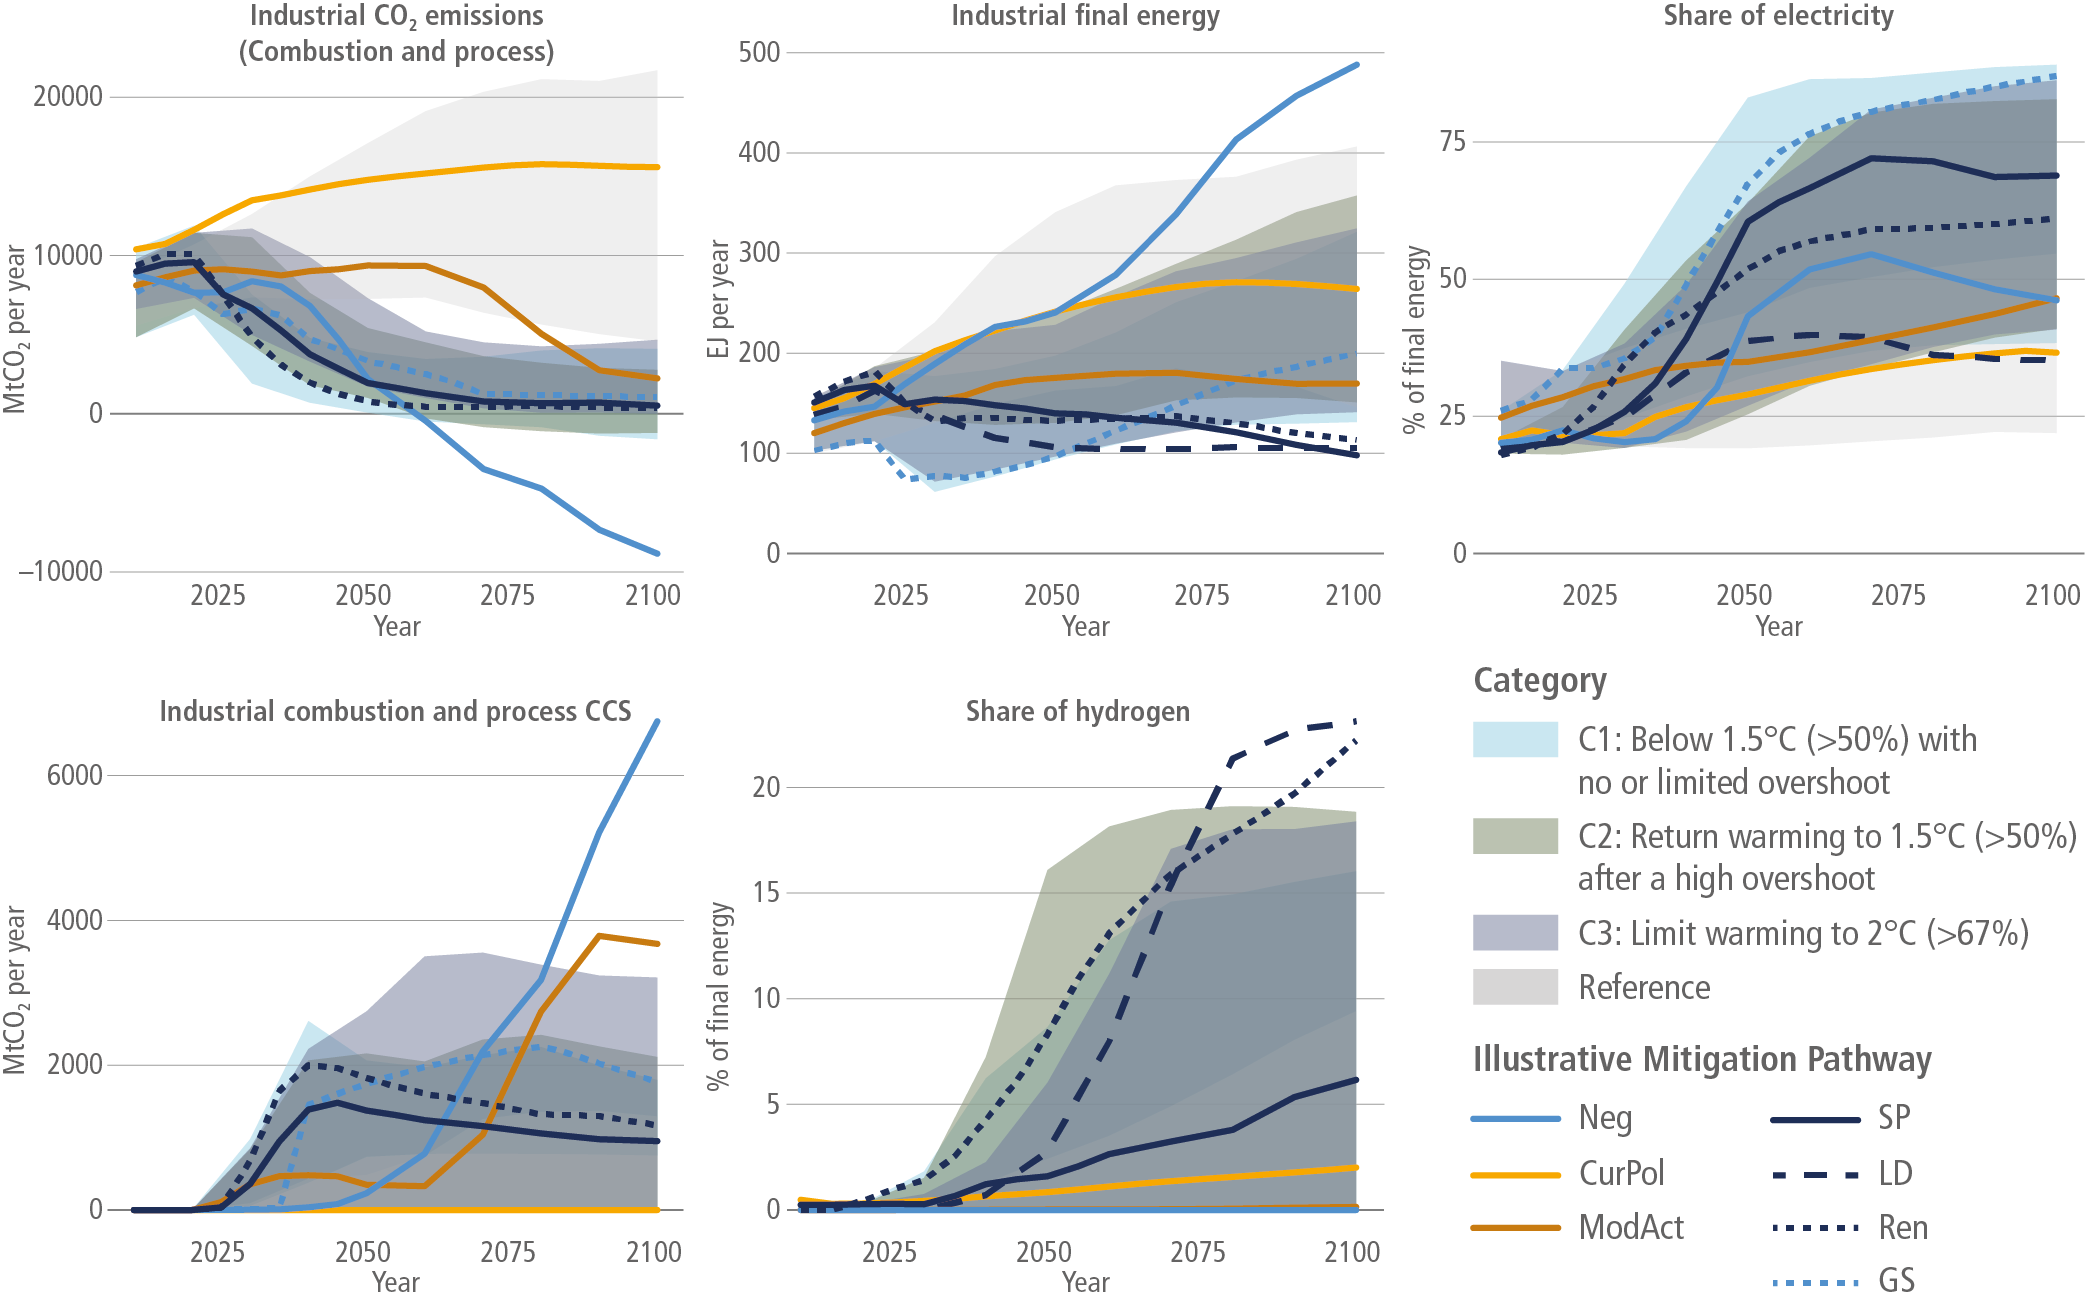
Figure caption
Figure 11.12 | Comparison of industry-sector-related CO2 emissions (including process emissions), final energy demand, share of electricity and hydrogen in the final energy mix, and industrial carbon capture and storage (CCS) for different mitigation scenarios representing illustrative mitigation pathways and the full sample of integrated assessment models (IAM) scenario results for three temperature categories (figure based on scenario database). Indicators in the Illustrative Mitigation Pathways (lines) and the 5–95% range of reference, 1.5°C and 2°C scenarios (shaded areas). The selected IMPs reflect the following characteristics: opportunities for reducing demand (IMP-LD; low demand), the role of deep renewable energy penetration and electrification (IMP-Ren; renewables), extensive use of carbon dioxide removal (CDR) in the industry and the energy sectors to achieve net-negative emissions (IMP-Neg), insights into how shifting development can lead to deep emission reductions and achieve sustainable development goals (IMP-SP; shifting pathways), and insights into how slower short-term emissions reductions can be compensated by very fast emission reductions later on (IMP-GS; gradual strengthening). Furthermore, two scenarios were selected to illustrate the consequences of current policies and pledges; these are CurPol (Current Policies) and ModAct (Moderate Action), and are referred to as Pathways Illustrative of Higher Emissions. Source: data are from the AR6 database; only scenarios that pass the vetting criteria are included (Section 3.2).