Figure 11.13
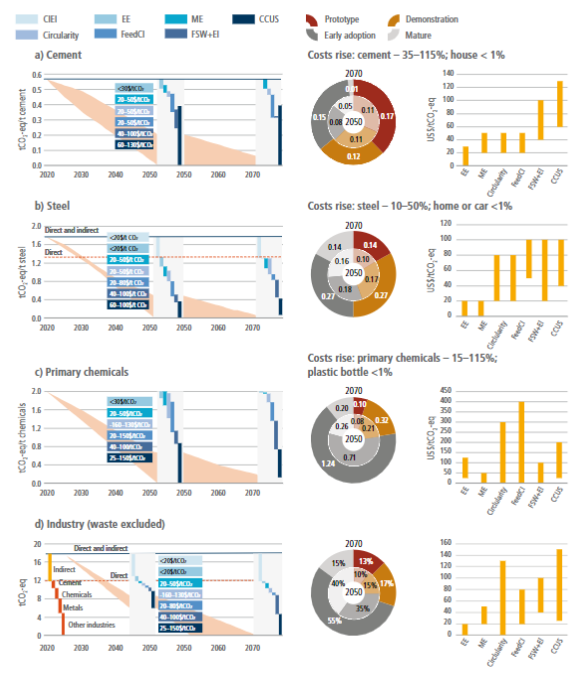
Figure caption
Figure 11.13 | Potentials and costs for zero-carbon mitigation options for industry and basic materials: CIEL – carbon intensity of electricity for indirect emissions; EE – energy efficiency; ME – material efficiency; Circularity – material flows (clinker substituted by coal fly ash, blast furnace slag or other by-products and waste, steel scrap, plastic recycling, etc.); FeedCI – feedstock carbon intensity (hydrogen, biomass, novel cement, natural clinker substitutes); FSW+El – fuel switch and processes electrification with low-carbon electricity. Ranges for mitigation options are shown based on bottom-up studies for grouped technologies packages, not for single technologies. In circles, contribution to mitigation from technologies based on their readiness are shown for 2050 (2040) and 2070. Direct emissions include fuel combustion and process emissions. Indirect emissions include emissions attributed to consumed electricity and purchased heat. For basic chemicals only methanol, ammonia and high-value chemicals are considered. The total for industry doesn’t include emissions from waste. Base values for 2020 for direct and indirect emissions were calculated using 2019 GHG emission data (Crippa et al. 2021) and data for materials production from World Steel Association (2020a) and IEA (2021d). Negative mitigation costs for some options like Circularity are not reflected. Data from sources: Pauliuk et al. (2013a); Fawkes et al. (2016); WBCSD (2016); Bazzanella and Ausfelder (2017); IEA (2018a, 2019b,g,h, 2020a,c, 2021a); Lehne and Preston (2018); Scrivener et al. (2018); EUROFER (2019); Friedmann et al. (2019); Material Economics (2019); Sandalow et al. (2019); CAT (2020); CEMBUREAU (2020); Gielen et al. (2020); Habert et al. (2020); World Steel Association (2020b); Bataille (2020a); GCCA (2021a); and Saygin and Gielen (2021).