Back to chapter figures
Figure 11.3
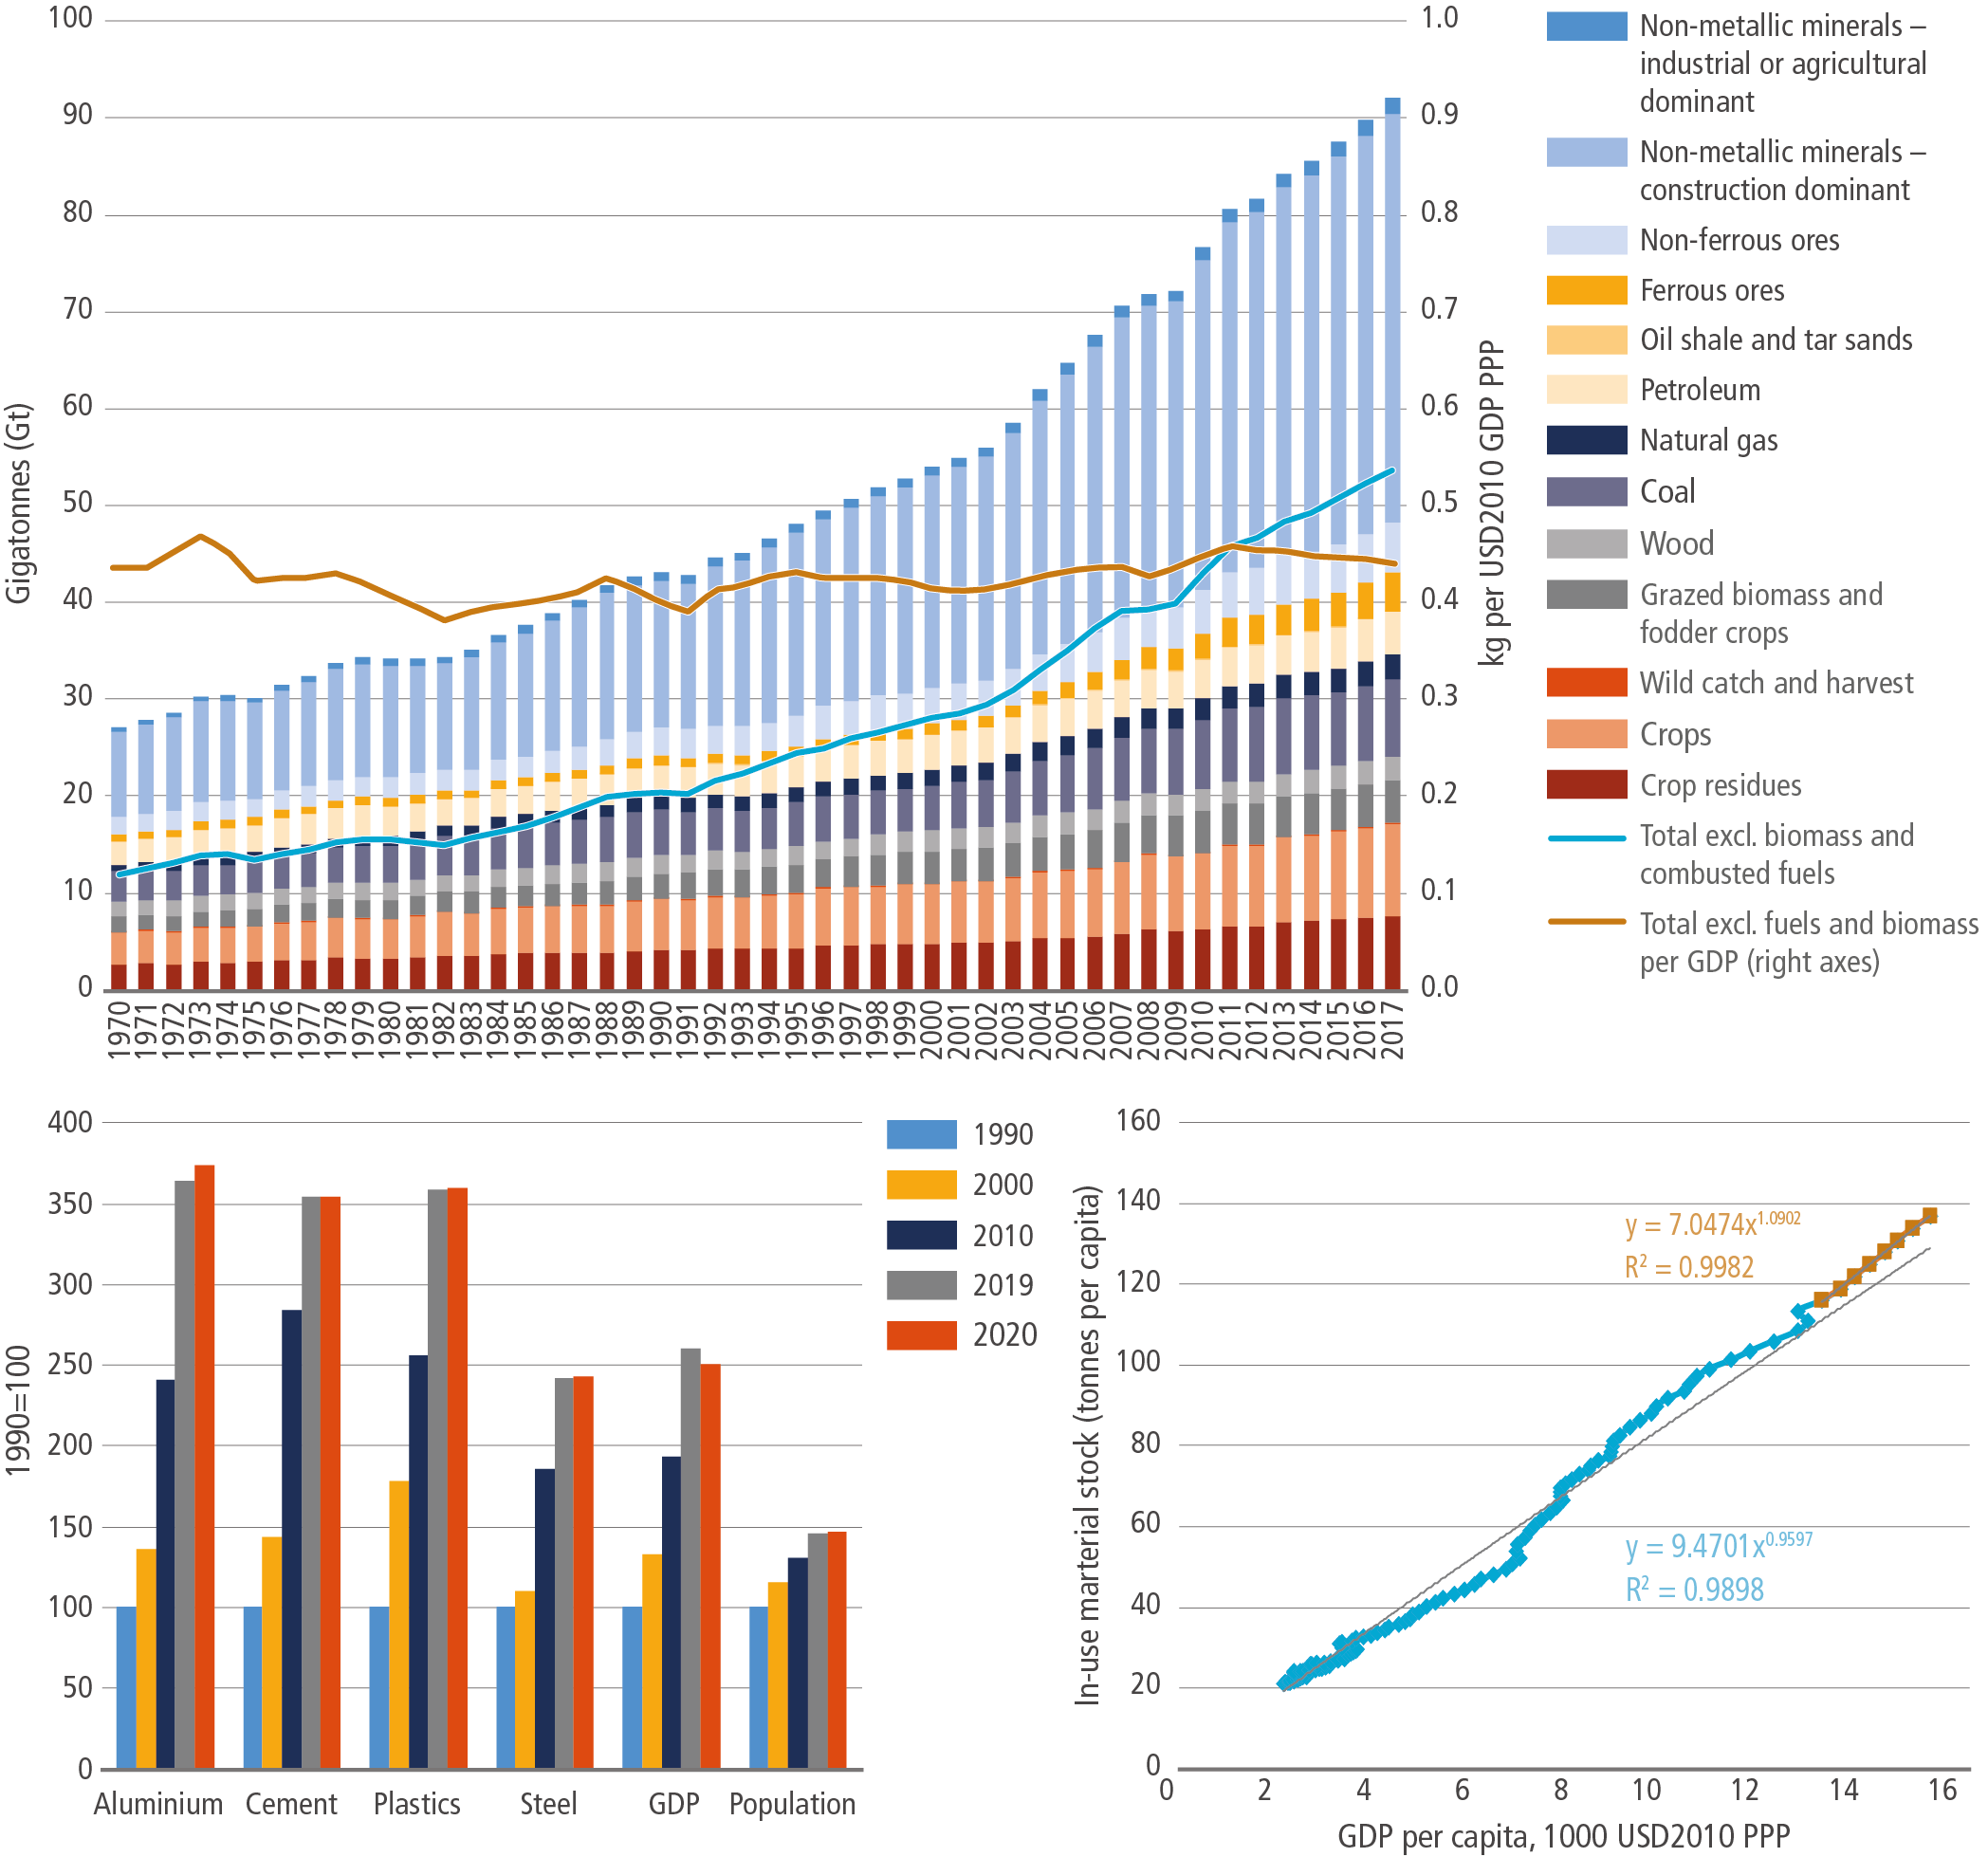
Figure caption
Figure 11.3 | Raw natural materials extraction since 1970. In windows: left – growth of population, GDP and basic materials production (1990 = 100) in 1990–2020; right – in-use stock per capita vs income level (1900–2018; brown dots are for 2000–2018). The regressions provided show that for more recent years elasticity of material stock to GDP was greater than unity, comparing with the lower unity in preceding years. Source: developed based on Maddison Project (2018); Wiedenhofer et al. (2019); IEA (2020b); UNEP and IRP (2020); International Aluminium Institute (2021a); Statista (2021a,b); U.S. Geological Survey (2021); World Bank (2021); World Steel Association (2021).