Back to chapter figures
Figure 12.2
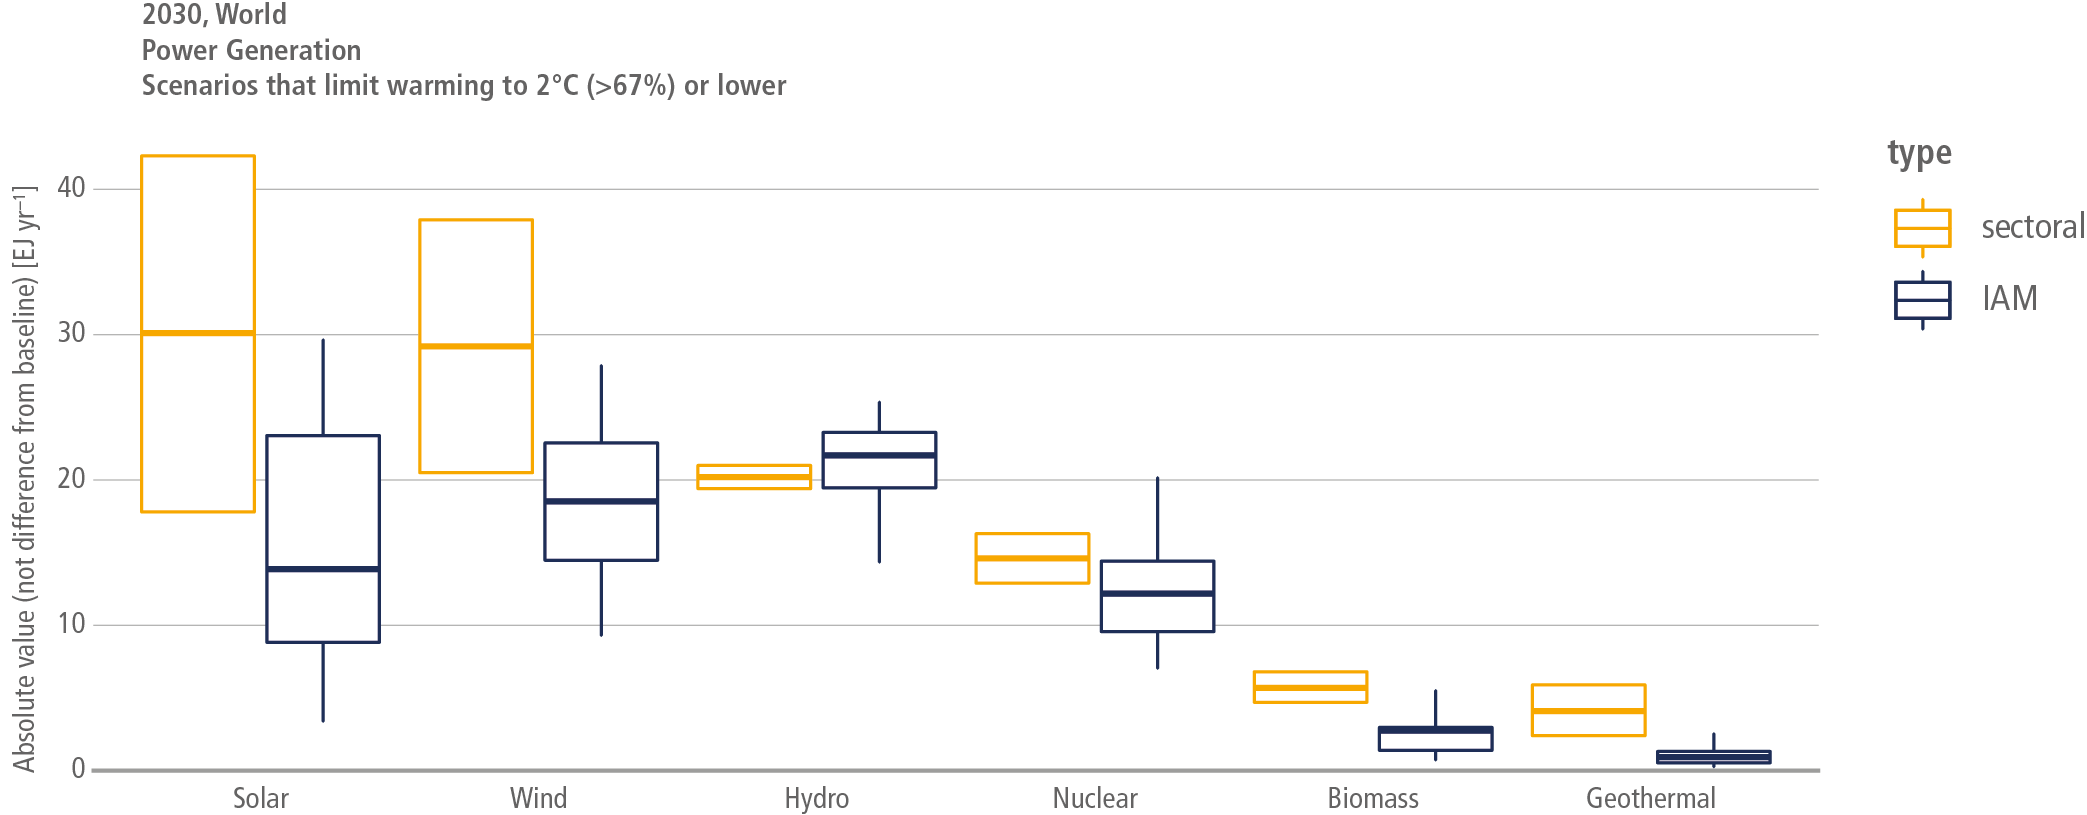
Figure caption
Figure 12.2 | Electricity production in 2030 as calculated by IAMs (dark blue), compared with electricity production potentials found in the sectoral analysis (yellow). Cost cut-offs at USD100 tCO2–1 are applied to both electricity production in 2030 as calculated by IAMs and electricity production potentials found in the sectoral analyses. Hinges in the dark-blue box plots represent the interquartile ranges and whiskers extend to the 5th and 95th percentiles, while the hinges in the yellow box plots describe the full range.