Figure 12.4
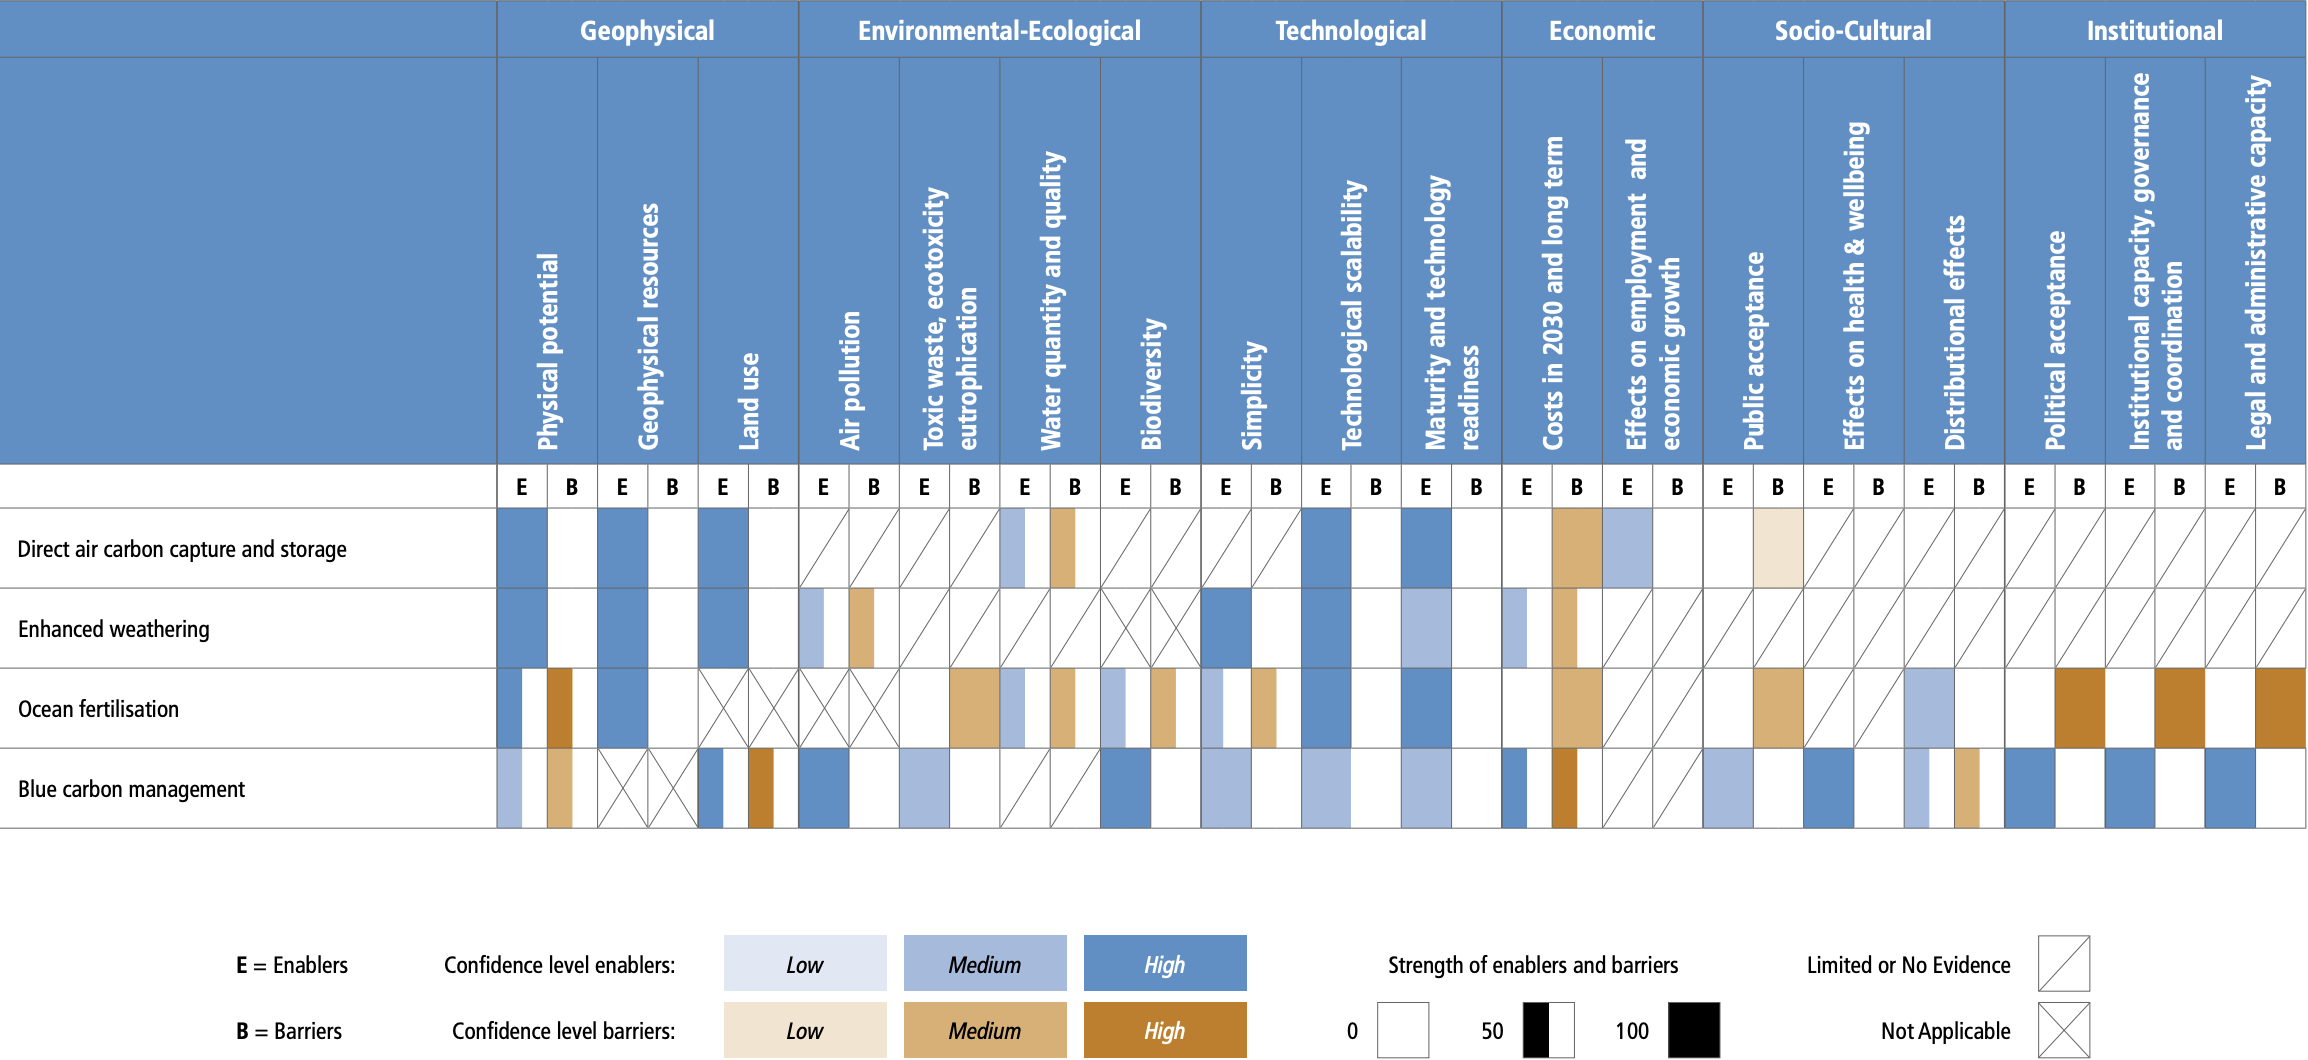
Figure caption
Figure 12.4 | Summary of the extent to which different factors would enable or inhibit the deployment of the carbon dioxide removal methods DACCS, EW, ocean fertilisation and blue carbon management. Blue bars indicate the extent to which the indicator enables the implementation of the CDR method (E) and orange bars indicate the extent to which an indicator is a barrier (B) to the deployment of the method, relative to the maximum possible barriers and enablers assessed. An ‘X’ signifies the indicator is not applicable or does not affect the feasibility of the method, while a forward slash indicates that there is no or limited evidence whether the indicator affects the feasibility of the method. The shading indicates the level of confidence, with darker shading signifying higher levels of confidence. Supplementary Material 12.SM.B provides an overview of the factors affecting the feasibility of CDR methods and how they differ across contexts (e.g., region), time (e.g., 2030 versus 2050), and scale (e.g., small versus large), and includes a line of sight on which the assessment is based. The assessment methodology is explained in Annex II, Part IV, Section 11.