Figure 12.6
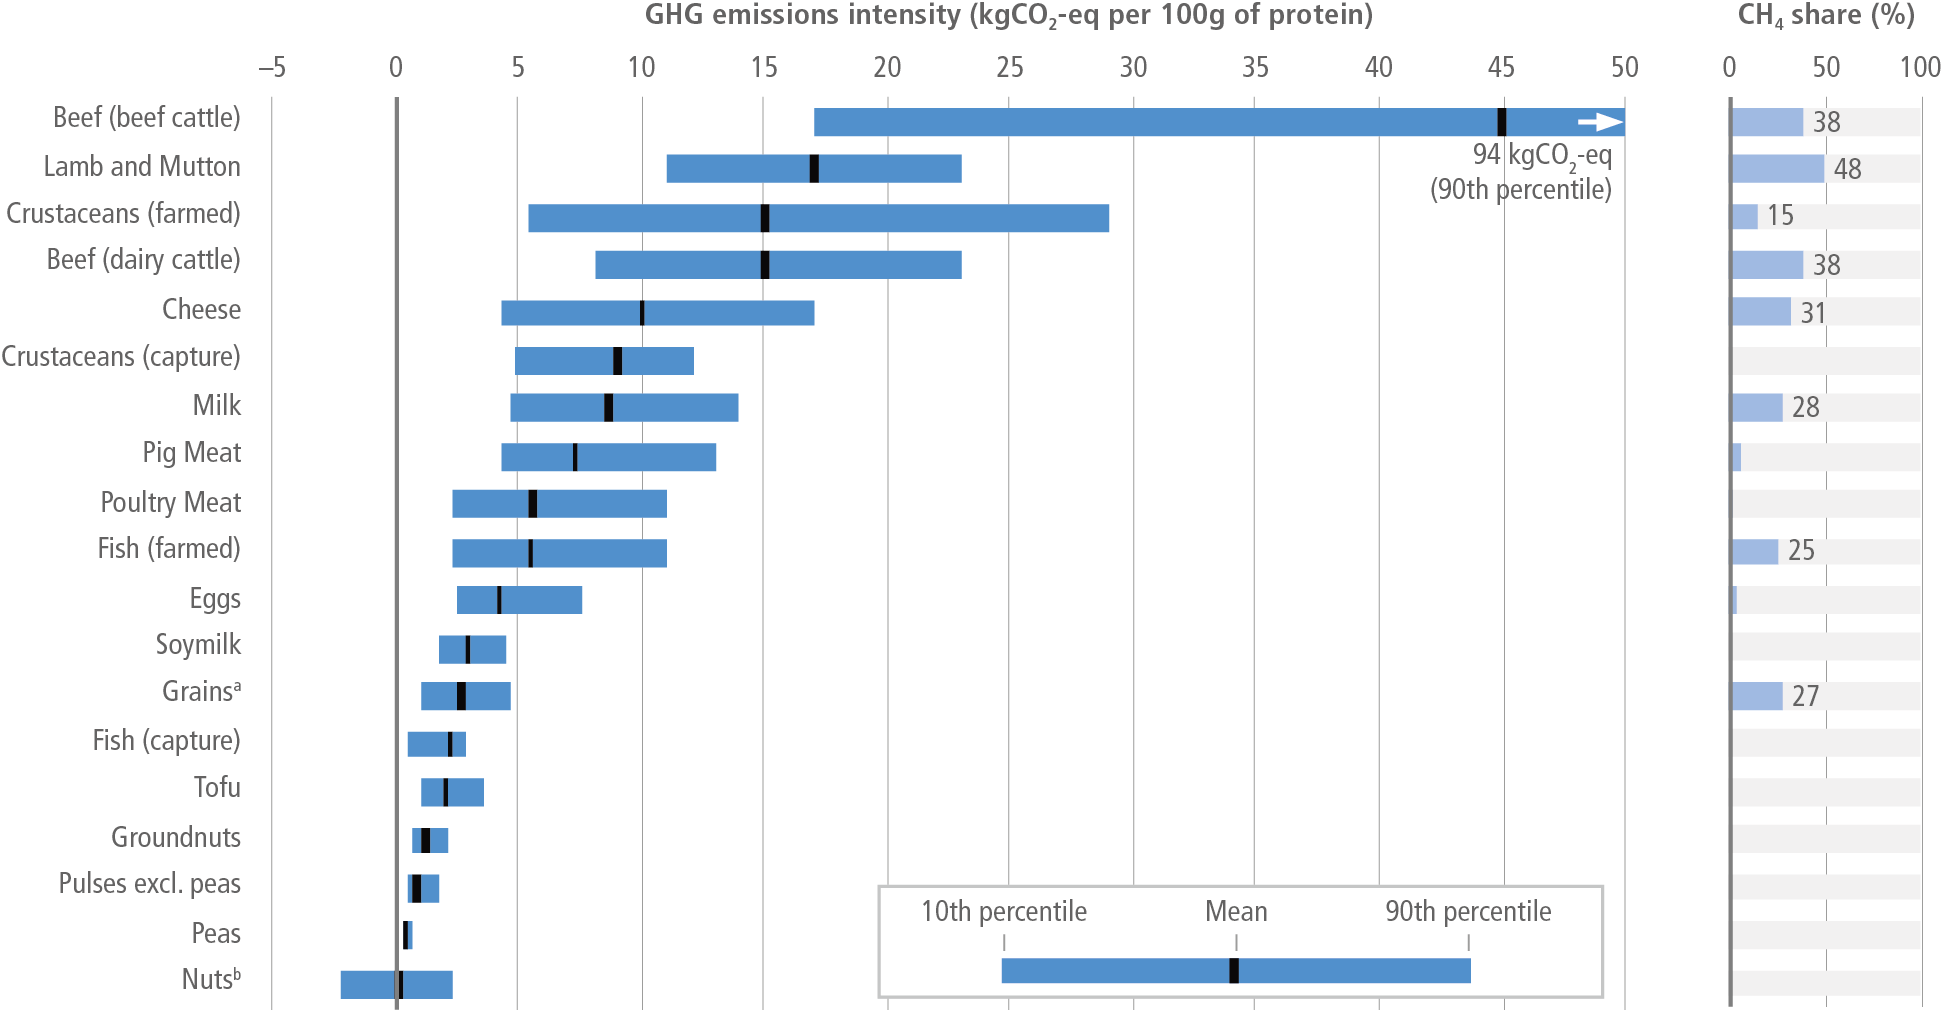
Figure caption
Figure 12.6 | Ranges of GHG intensities [kgCO2-eq per 100 g protein, 10–90th percentile] in protein-rich foods, quantified via a meta-analysis of attributional lifecycle assessment studies using economic allocation. Aggregation of CO2, CH4, and N2O emissions in Poore and Nemecek (2018) updated to use AR6 100-year GWP. Data for capture fish, crustaceans, and cephalopods from Parker et al. (2018), with post-farm data from Poore and Nemecek (2018), where the ranges represent differences across species groups. CH4 emissions include emissions from manure management, enteric fermentation, and flooded rice only. a Grains are not generally classed as protein-rich, but they provide about 41% of global protein intake. Here grains are a weighted average of wheat, maize, oats, and rice by global protein intake. b Conversion of annual to perennial crops can lead to carbon sequestration in woody biomass and soil, shown as negative emissions intensity. Source: data from Poore and Nemecek (2018); Parker et al. (2018).