Figure 15.3
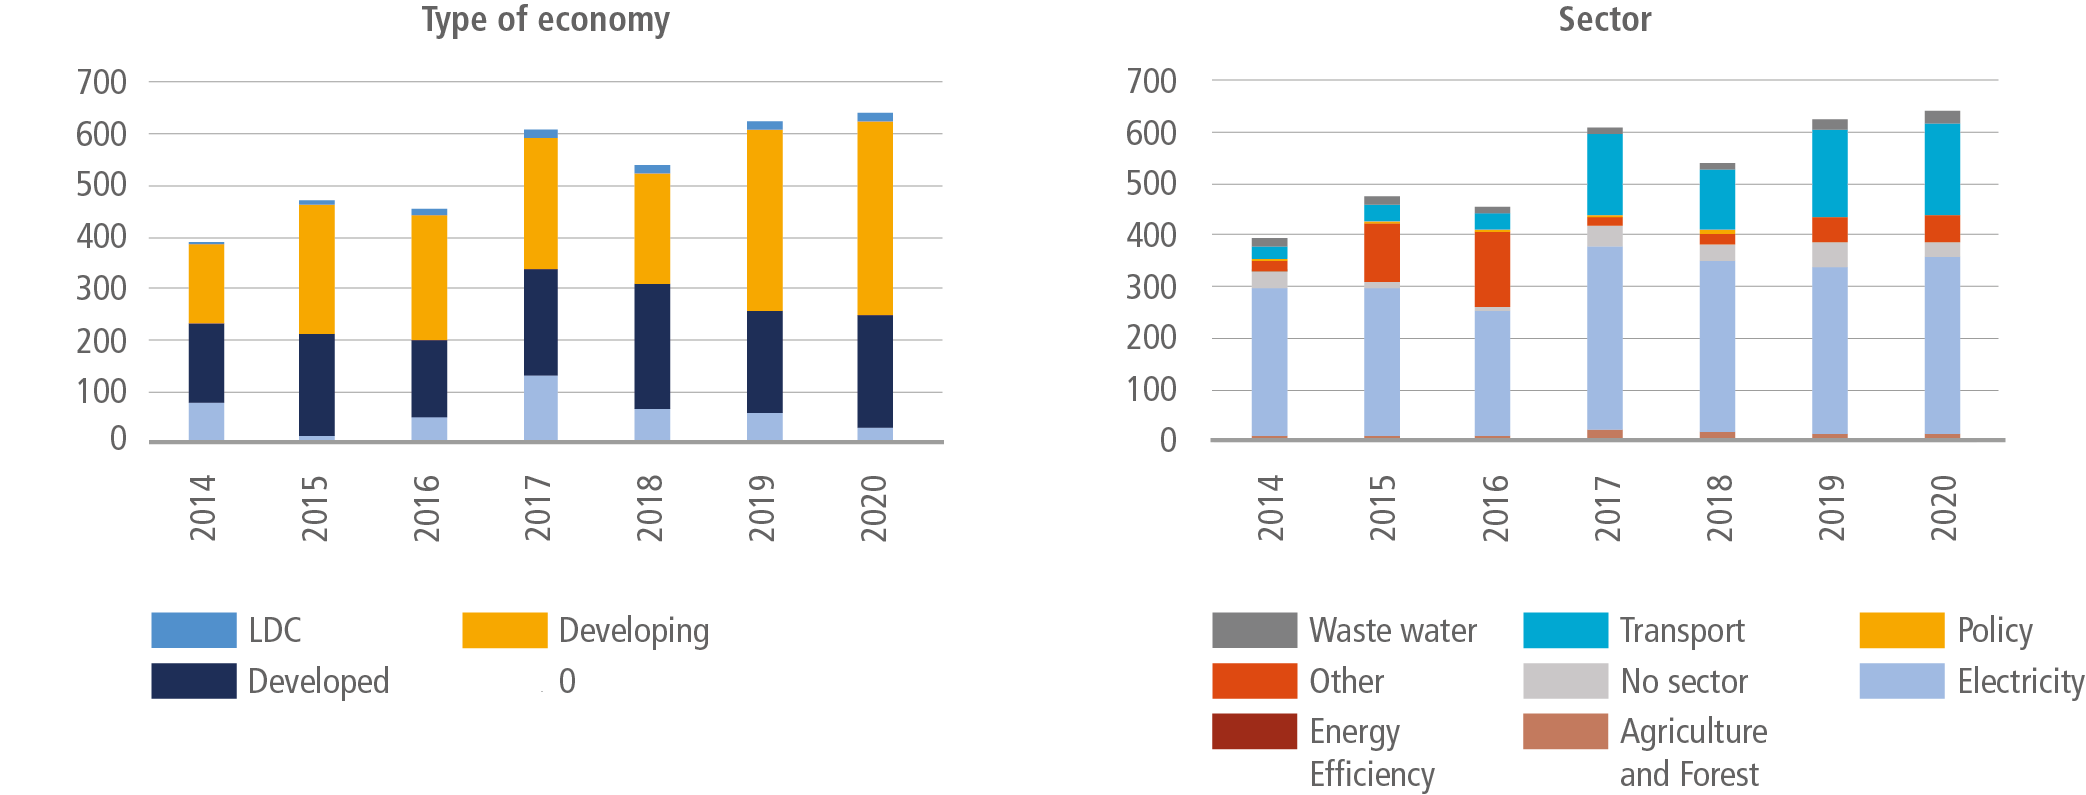
Figure caption
Figure 15.3 | Available estimates of global climate finance between 2014 and 2020. Note: Numbers in current billion USD. Deflated to USD2015 see Table 15.1 in italic. Type of Economy figure (left): Regional breakdown based on official UN country classification. ‘0’ no regional mapping information available. Sectoral figure (right): Policy includes Disaster Risk Management; Policy and national budget support and capacity building. Transport includes Sustainable/Low-carbon Transport. Energy Efficiency includes Industry, Extractive Industries, Manufacturing & Trade, Low-carbon Technologies, Information and Communications Technology, Buildings and Infrastructure. Electricity includes Renewable Energy Feneration, “Infrastructure, energy and other built environment”, Transmission and Distribution Systems, and Energy Systems. No sector means no sector information available, or negligible flows. Other includes Non-energy GHG reductions, Coastal Protection. Source: own calculations, based on Naran et al. (2021).