Box 16.1, Figure 1
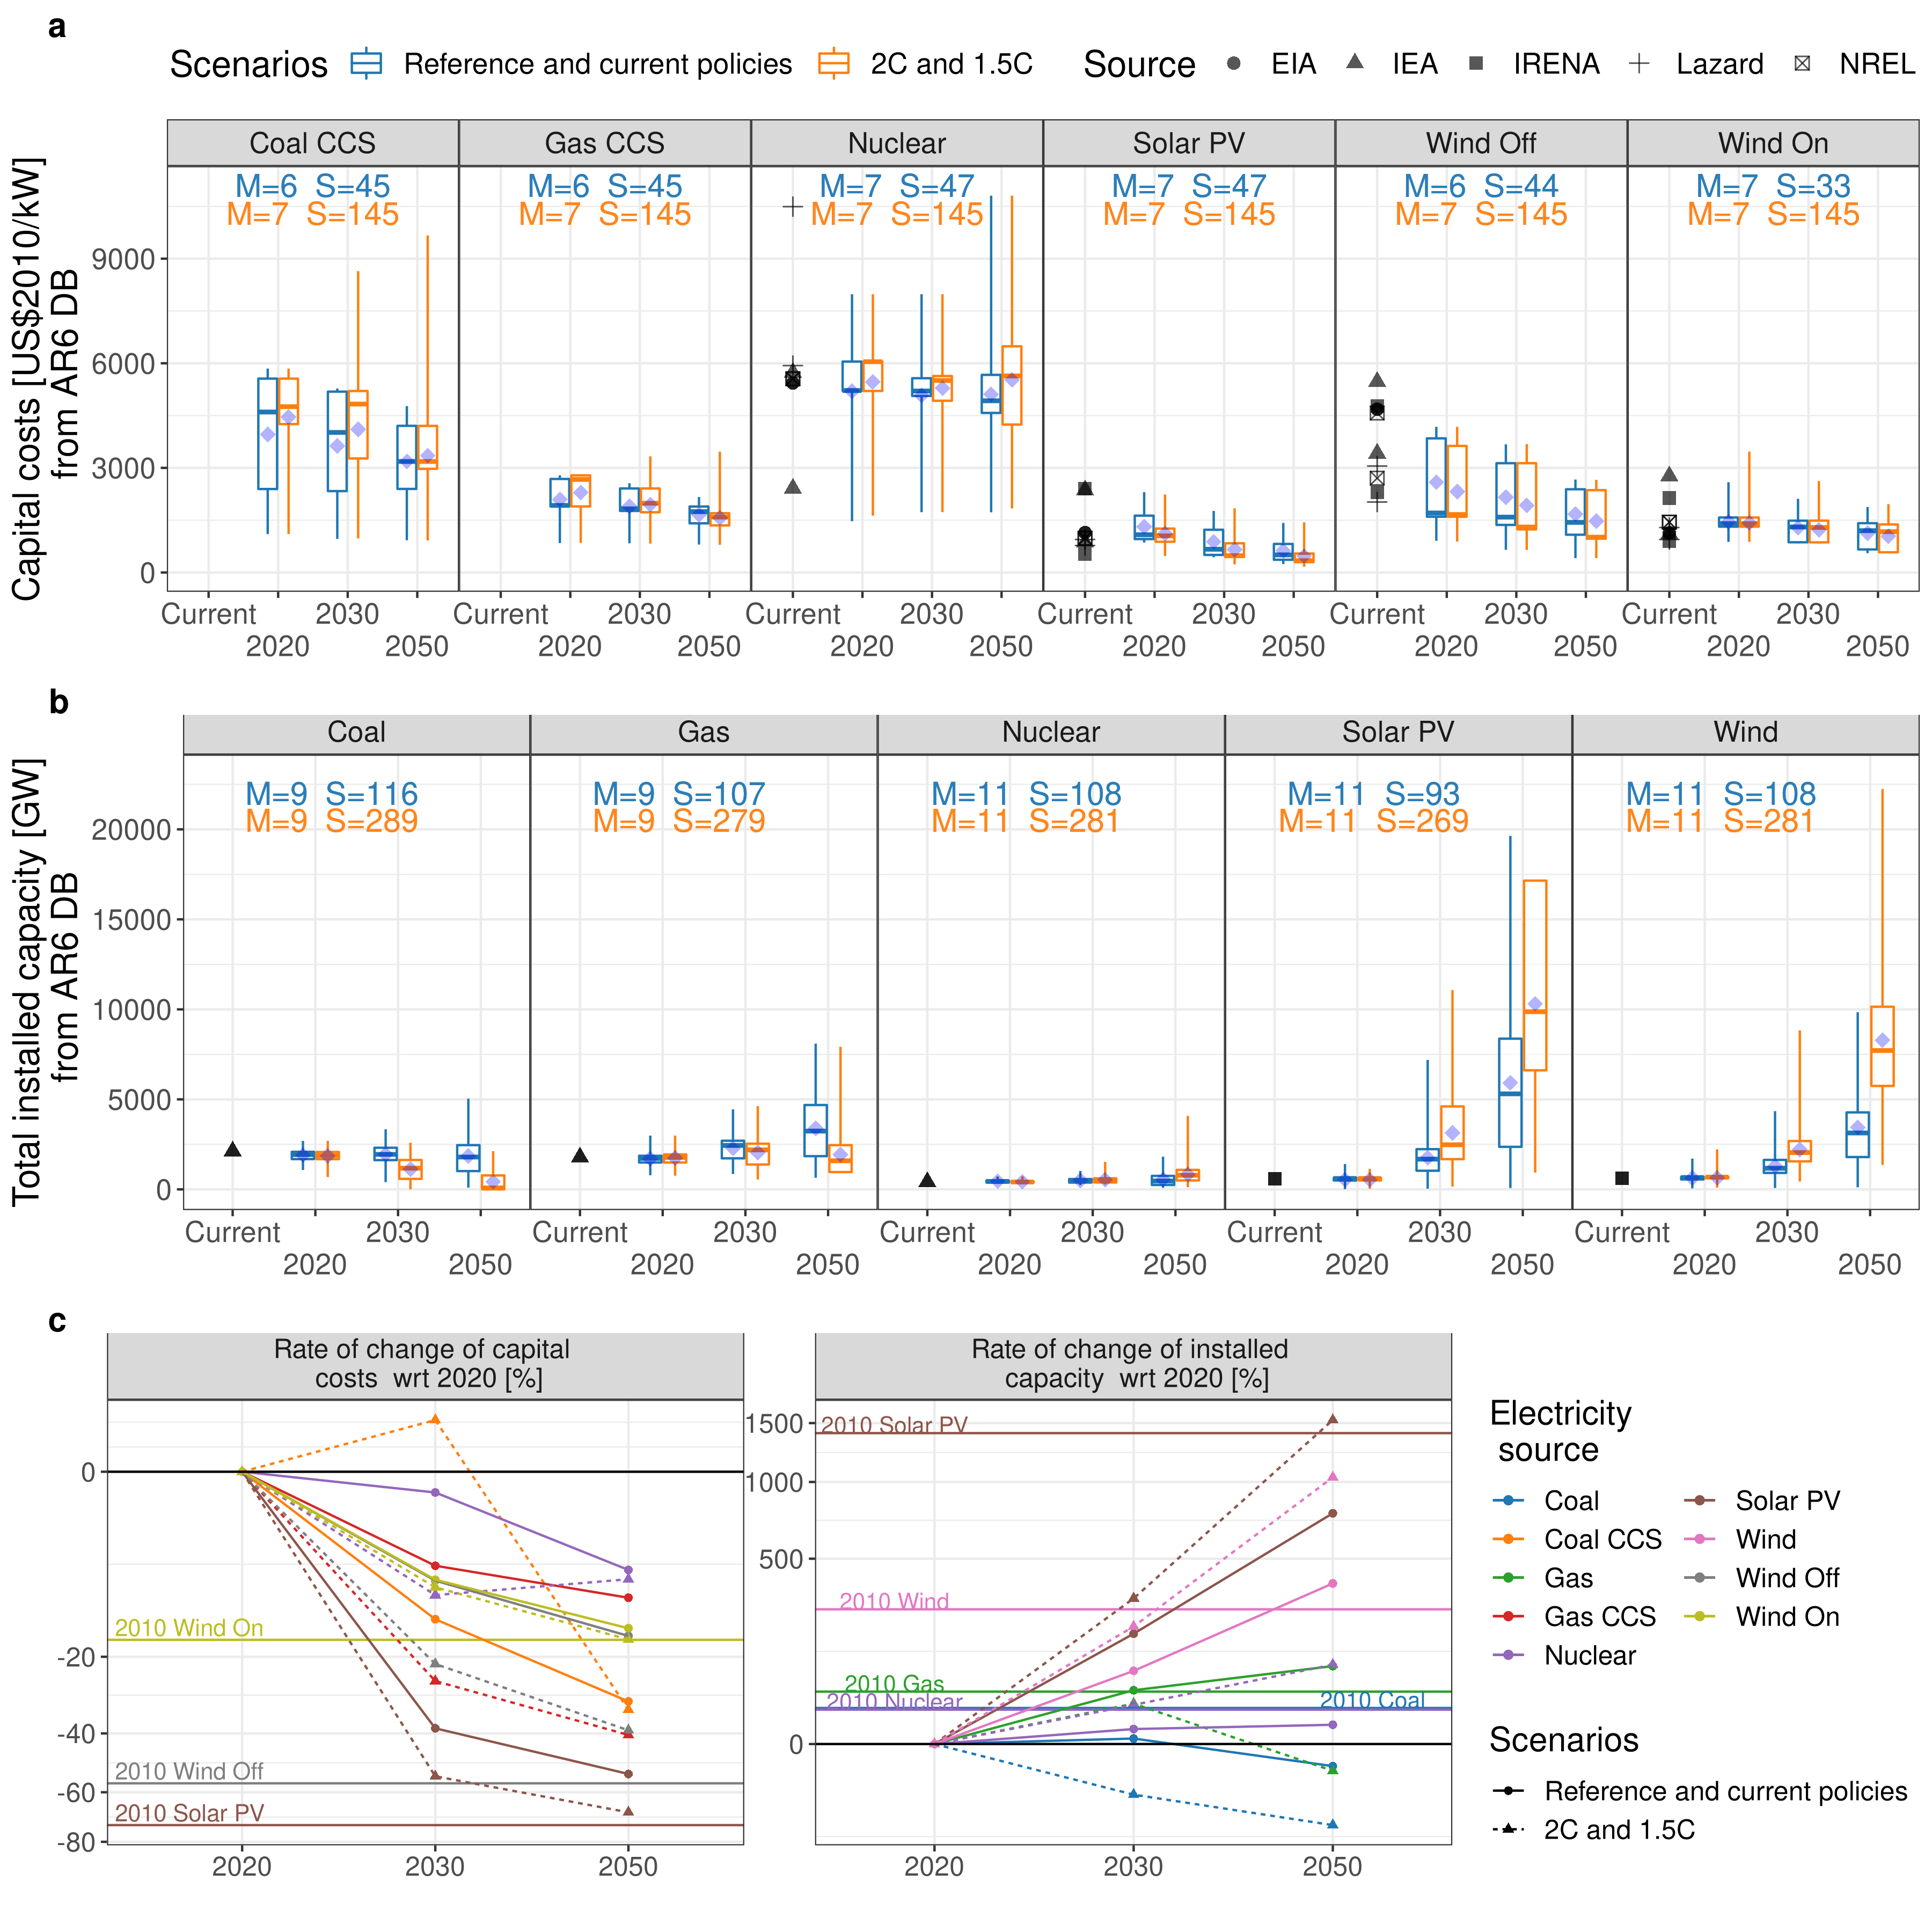
Figure caption
Box 16.1, Figure 1 | Global technology cost and deployment in two groups of AR6 scenarios: (i) scenarios that limit warming to 3°C (>50%) and scenarios that limit warming to 4°C (>50%) (“Reference and current policies”), and (ii) scenarios that limit warming to 2°C (>67%) or lower (“2°C and 1.5°C”). Panel (a) Current capital costs are sourced from Table 1 (Timilsina 2020); distribution of capital costs in 2030 and 2050 (AR6 Scenarios Database). Blue symbols represent the mean. ‘Current’ capital costs for coal and gas plants with CCS are not available; Panel (b) Total installed capacity in 2019 (IEA 2020c; IRENA 2020a, b); distribution of total installed capacity in 2030 and 2050 (AR6 Scenario Database). Blue symbols represent the mean; Panel (c) Percentage of change in capital costs and installed capacity between (2010–2020) and percentage of median change (2020–2030 and 2020–2050) (Medianyear–Median2020)/Median2020*100. ‘M’ indicates the number of models, ‘S’ the number of scenarios for which this data is available. ‘Reference and current policies’ are scenarios that limit warming to 3°C (>50%) and scenarios that limit warming to 4°C (>50%) (C6 and C7 AR6 scenario categories). ‘2C and 1.5C’ are scenarios that limit warming to 2°C (>67%) or lower (C1, C2 and C3 AR6 scenario categories). Each model may have submitted data for more than one model version.