Figure 2.10
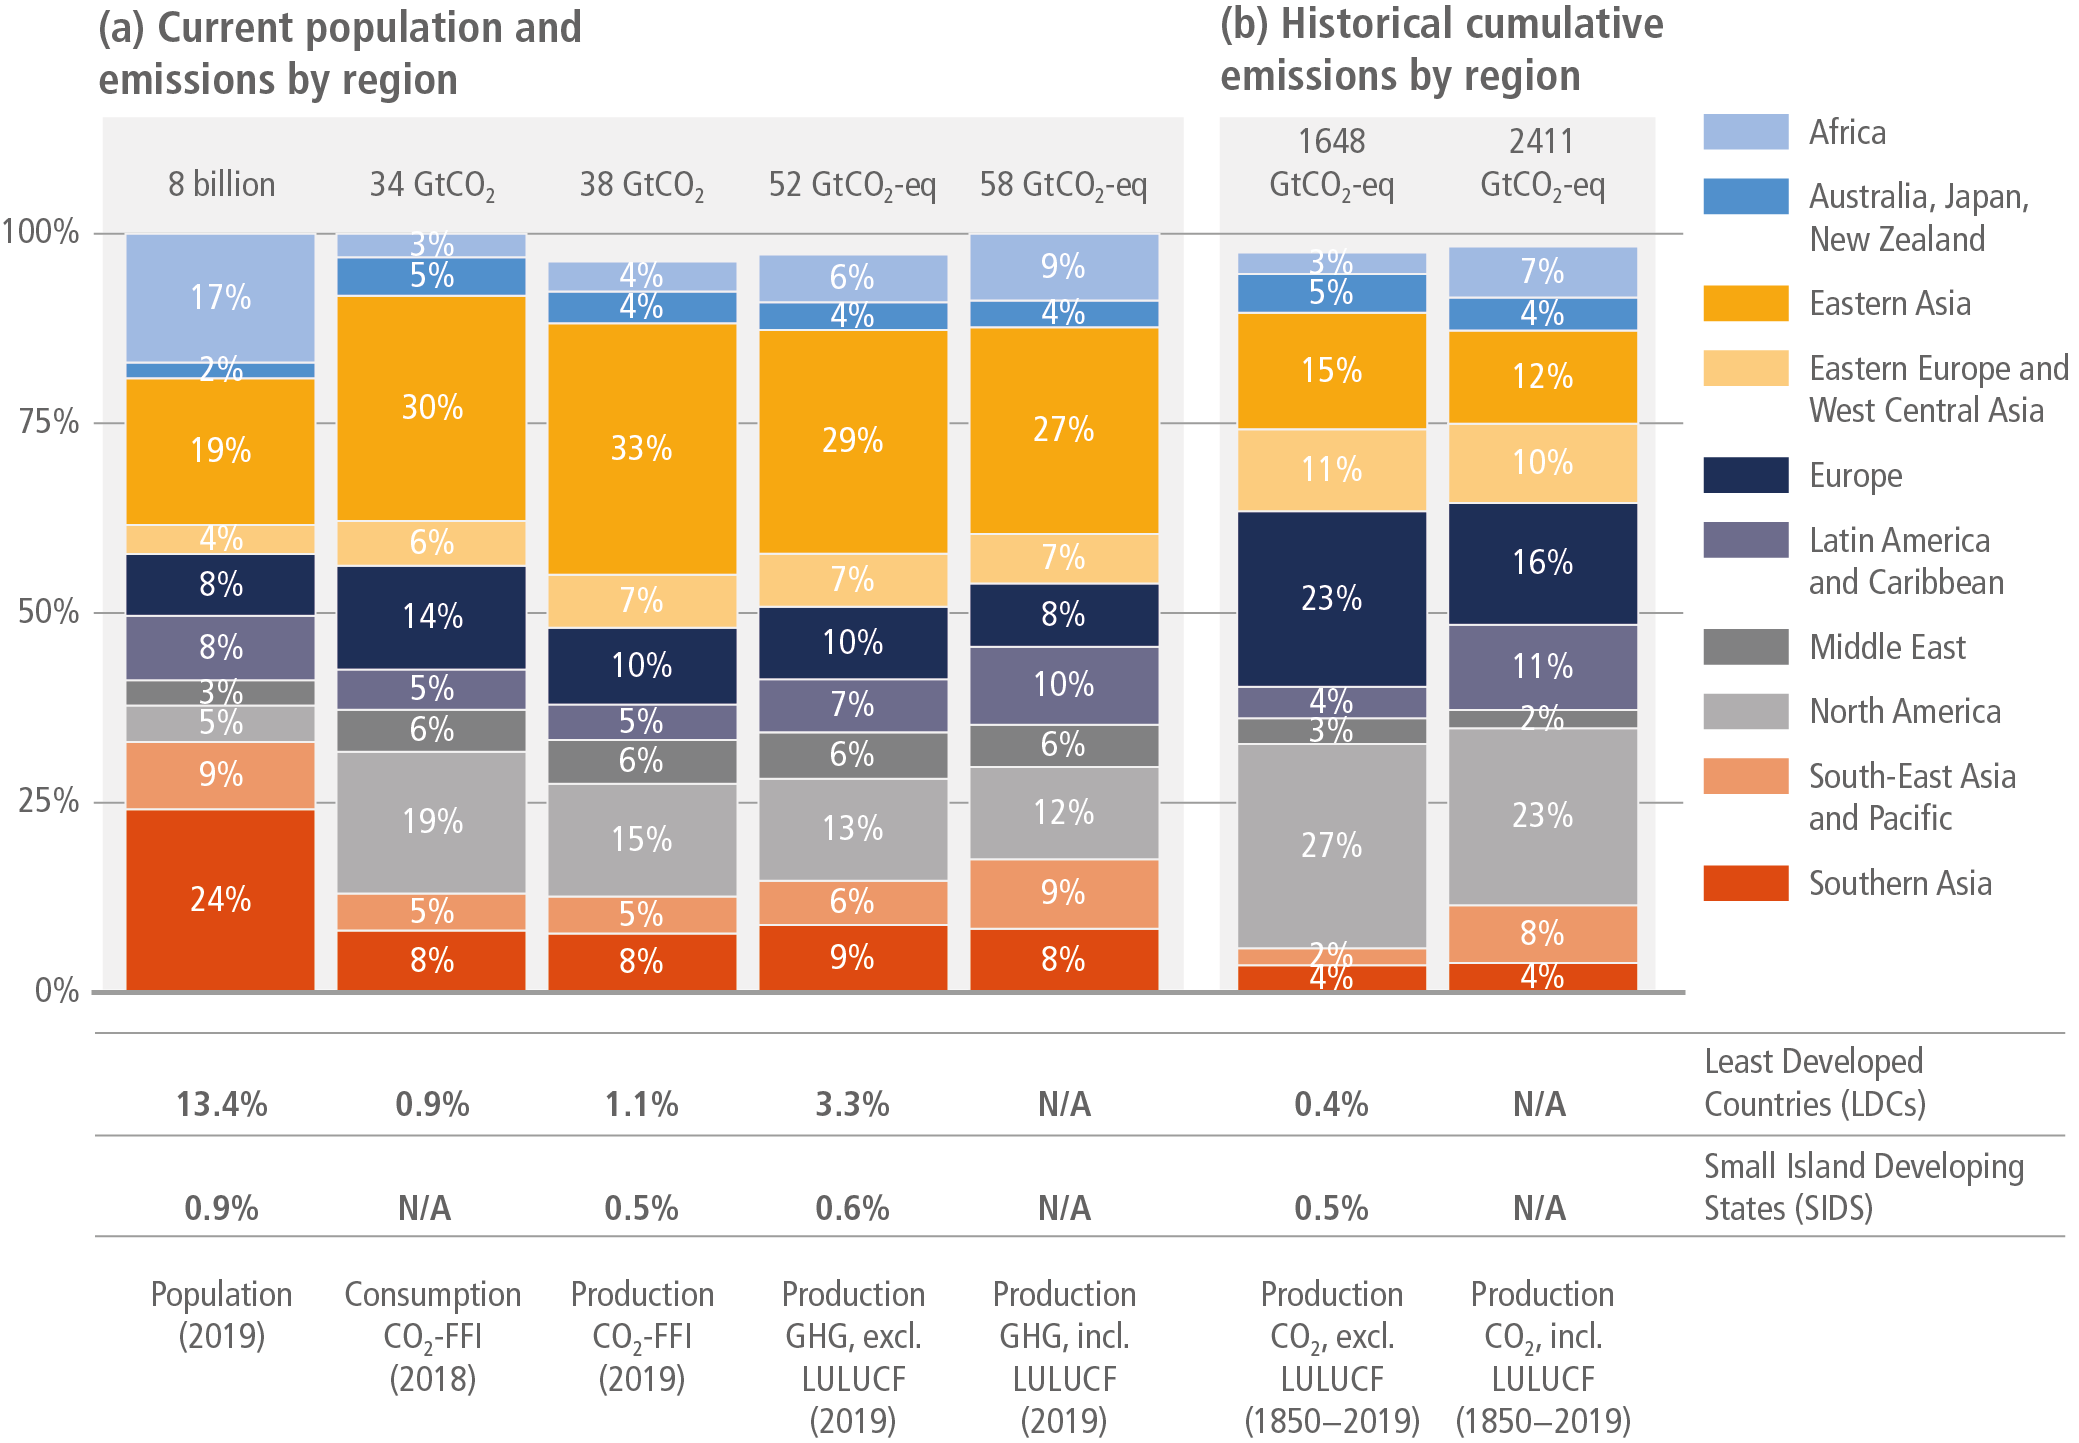
Figure caption
Figure 2.10 | Different perspectives on historic emissions and equity. Panel (a) shows the regional proportion (%) of total global population or emissions in 2018 or 2019, for five categories: population (persons); consumption-based CO2-FFI emissions (GtCO2); production-based CO2-FFI emissions (GtCO2); production-based GHG emissions excluding CO2-LULUCF (GtCO2-eq); and production-based GHG emissions including CO2-LULUCF (GtCO2-eq). Panel (b) shows the regional proportion (%) of total cumulative production-based CO2 emissions from 1850 to 2019, including and excluding CO2-LULUCF (GtCO2). In the lower panels, the proportion of each population or emissions category attributable to Least-Developed Countries and Small Island Developing States (SIDS) are shown, where available (CO2-LULUCF data is not available for these regions). GHG emissions are converted into CO2-equivalents based on global warming potentials with a 100-year time horizon (GWP100) from the IPCC Sixth Assessment Report (Forster et al. 2021a). Source: data from Friedglinstein et al. (2020).