Figure 2.13
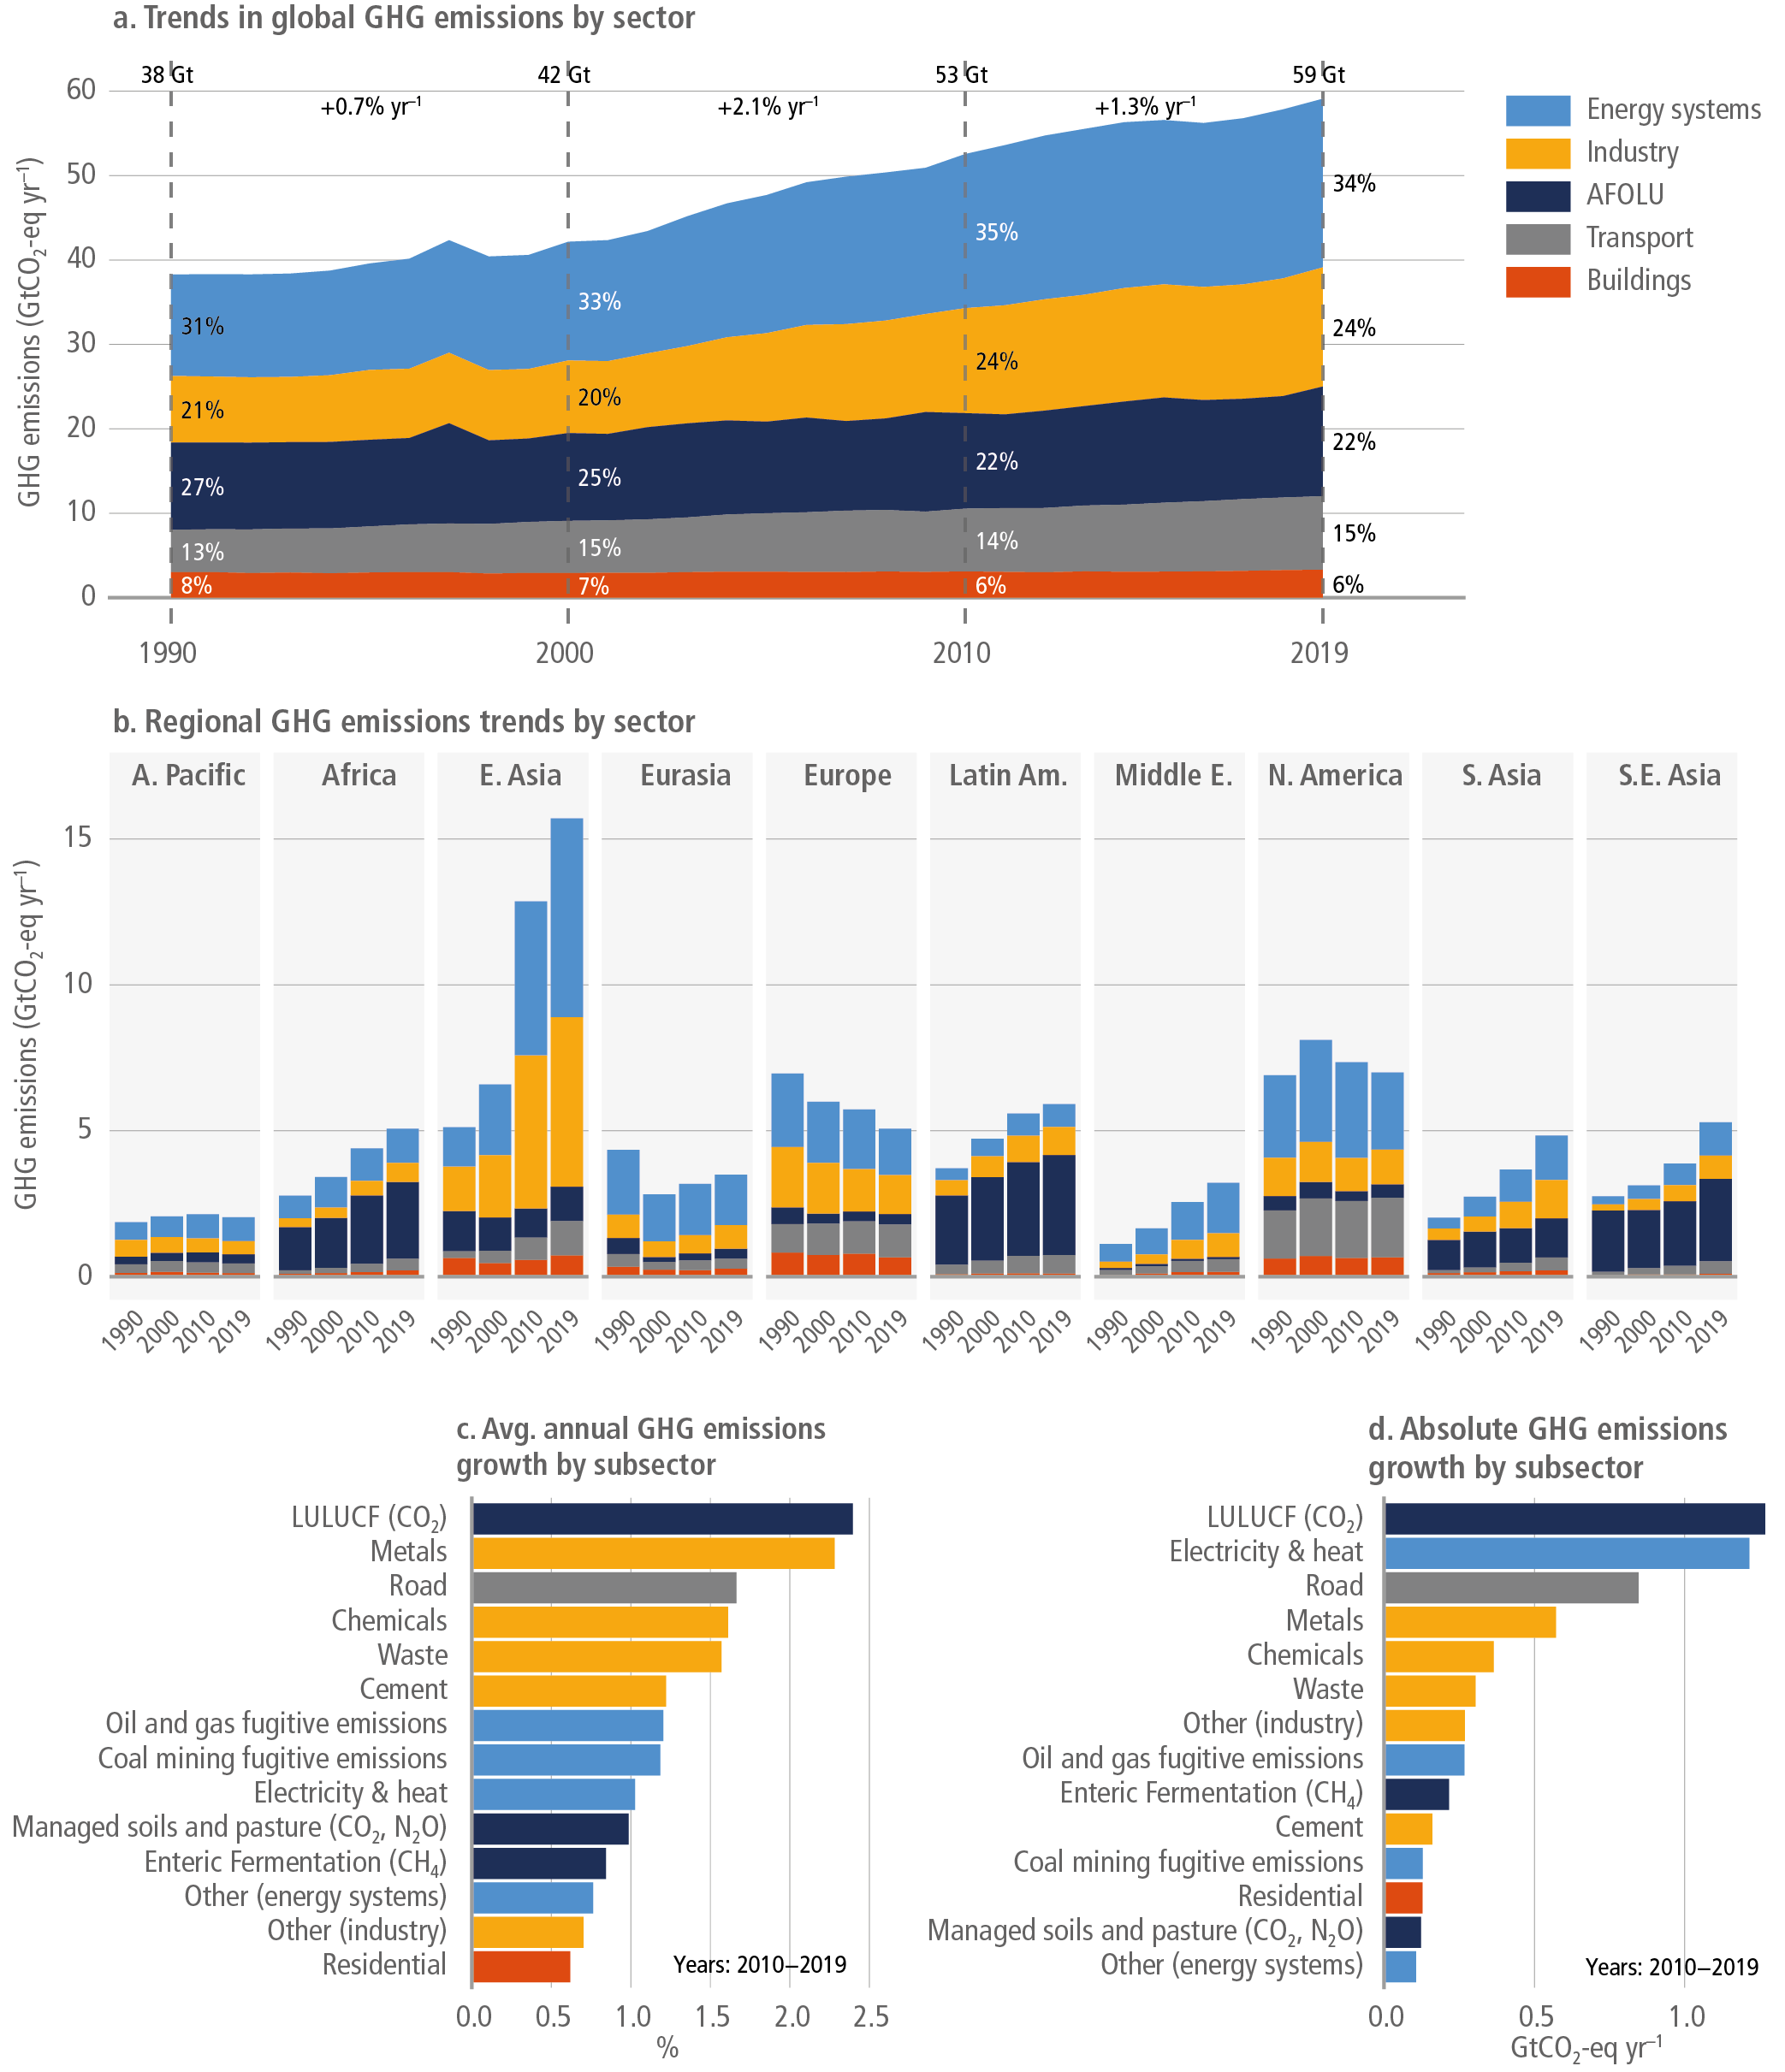
Figure caption
Figure 2.13 | Total annual anthropogenic GHG emissions by major economic sector and their underlying trends by region. Panel (a): Trends in total annual anthropogenic GHG emissions (in GtCO2-eq yr –1) by major economic sector. Panel (b): Trends in total annual anthropogenic GHG emissions (in GtCO2-eq yr –1) by major economic sector and region. Panels c and d: Largest subsectoral changes in GHG emissions for the reporting period 2010–2019 in relative (% annual change) and absolute terms (GtCO2-eq yr –1). Emissions are converted into CO2-equivalents based on global warming potentials with a 100-year time horizon (GWP100) from the IPCC Sixth Assessment Report. Source: based on Lamb et al. (2021b); Data: Crippa et al. (2021); Minx et al. (2021).