Back to chapter figures
Figure 2.15
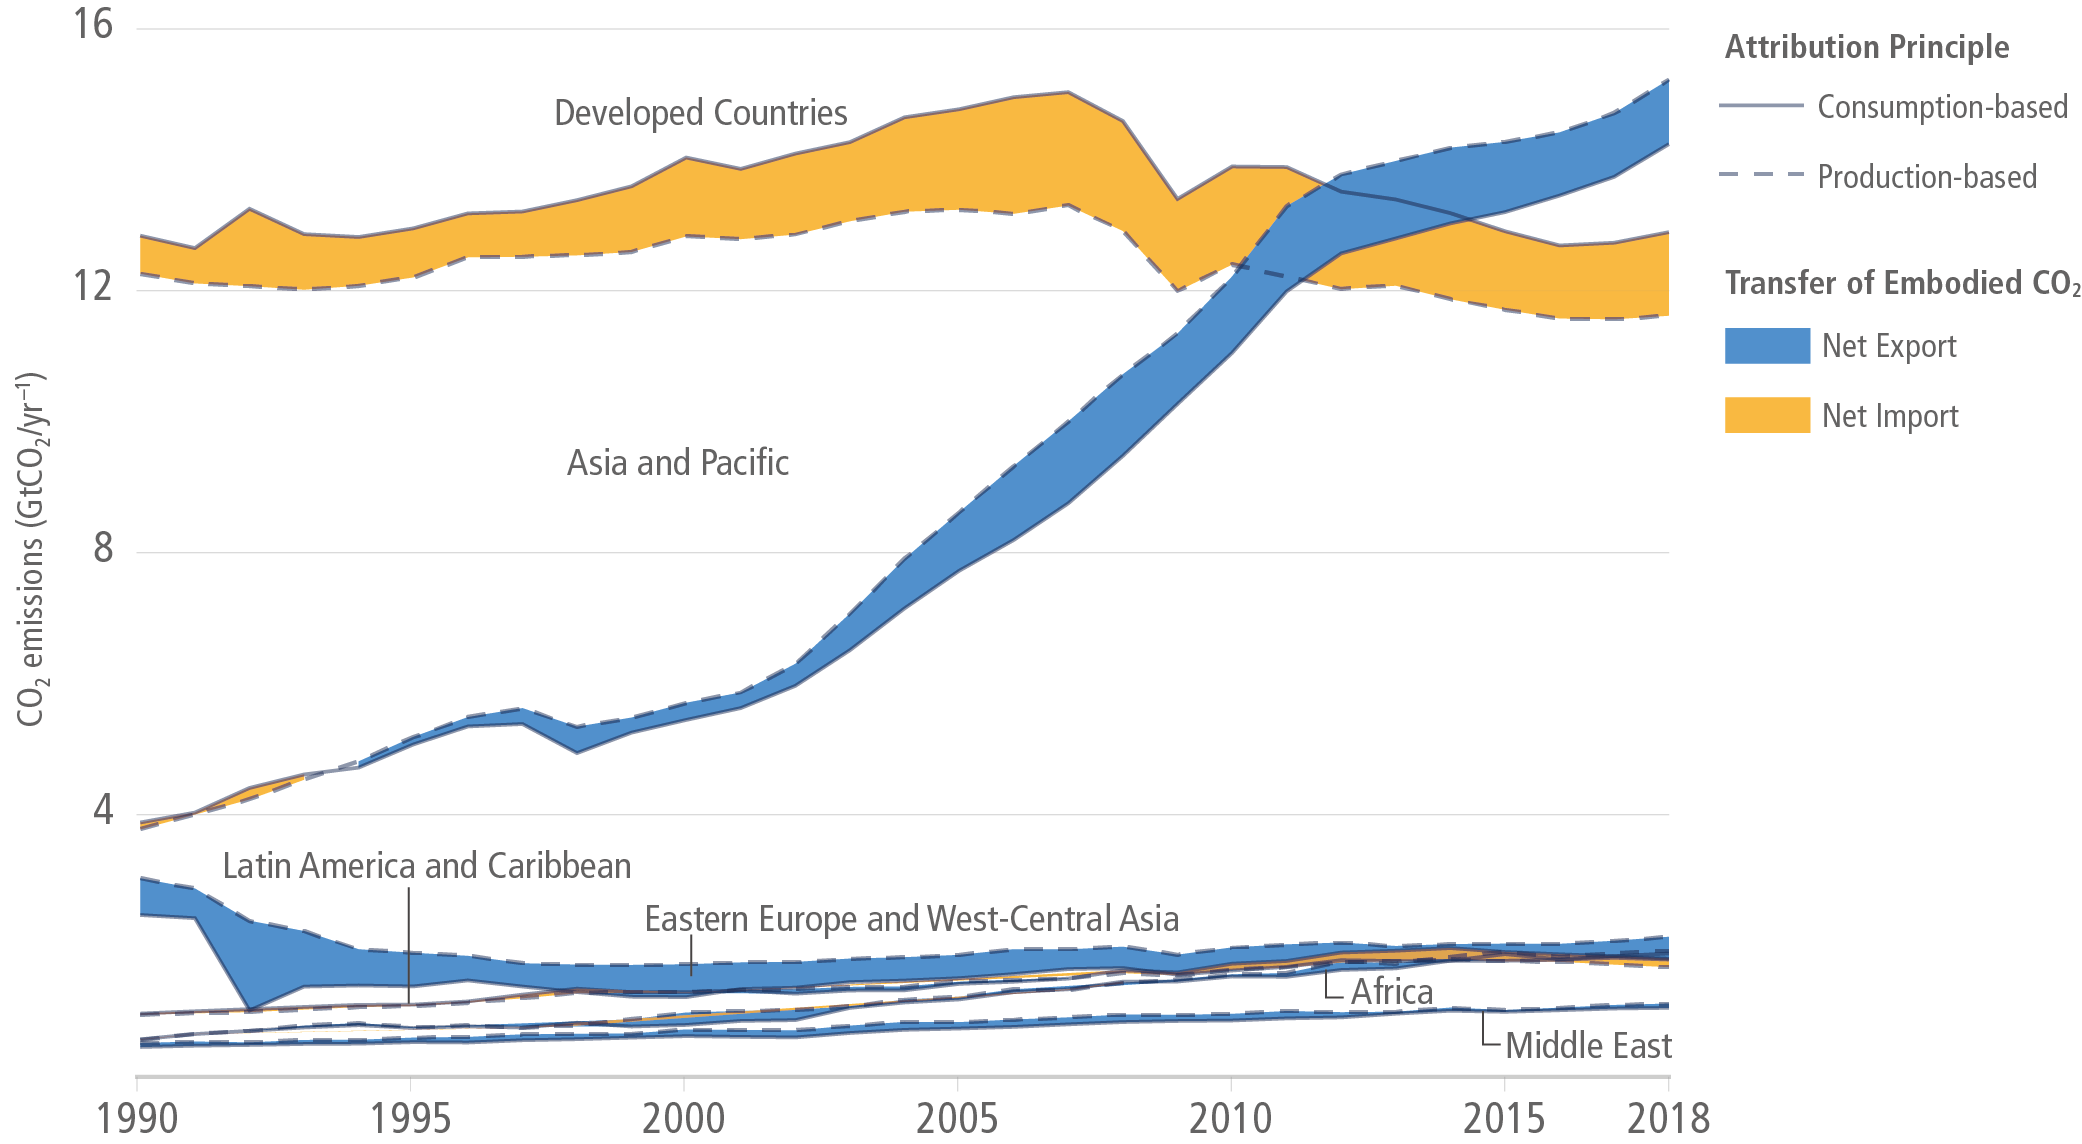
Figure caption
Figure 2.15 | Total annual CO2 emissions for 116 countries by global region based on consumption- and production-based emissions. The shaded areas are the net CO2 trade balances (differences) between each of the regions. Yellow shading indicates that the region is a net importer of embodied CO2 emissions, leading to consumption-based emission estimates that are higher than traditional territorial emission estimates. Blue shading indicates the reverse. Production-based emissions are collected from EDGAR and consumption-based emissions from the Global Carbon Budget 2020 (Friedlingstein et al. 2020). Source: this figure is modified based on Hubacek et al. (2021).