Back to chapter figures
Figure 2.24
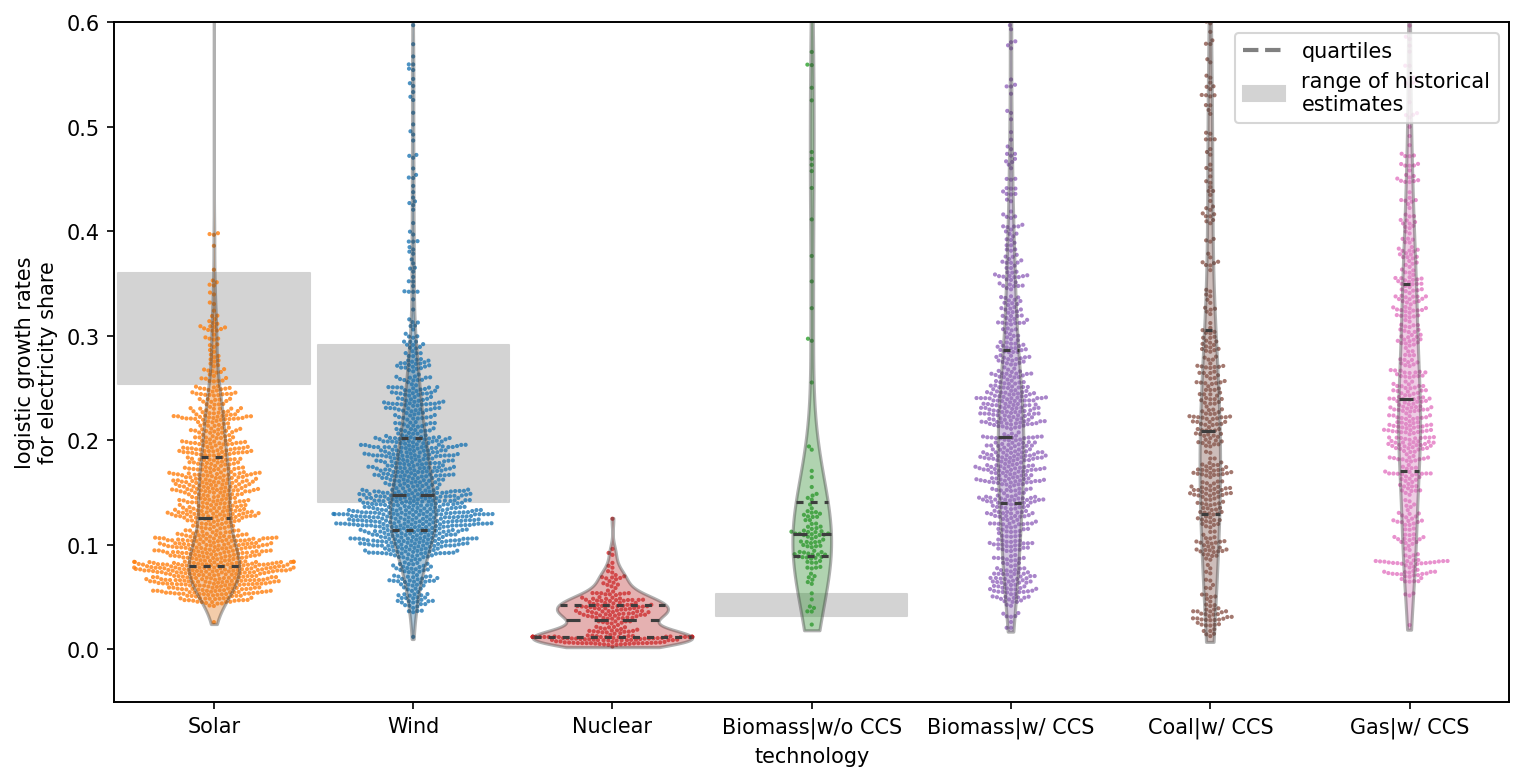
Figure caption
Figure 2.24 | Growth of key technologies (2020–2040) in Paris-consistent mitigation scenarios compared to historical growth. Comparisons of historical growth (grey bars) to growth in 2020–2040 mitigation scenarios (dots). Values on the vertical axis are logistic annual growth rates for share of each technology in electricity supply. Horizontal arrangement of dots within technology categories indicates the count of scenarios at each growth rate. Source: data on scenarios from Chapter 3; historical data from BP (2021).