Figure 2.3
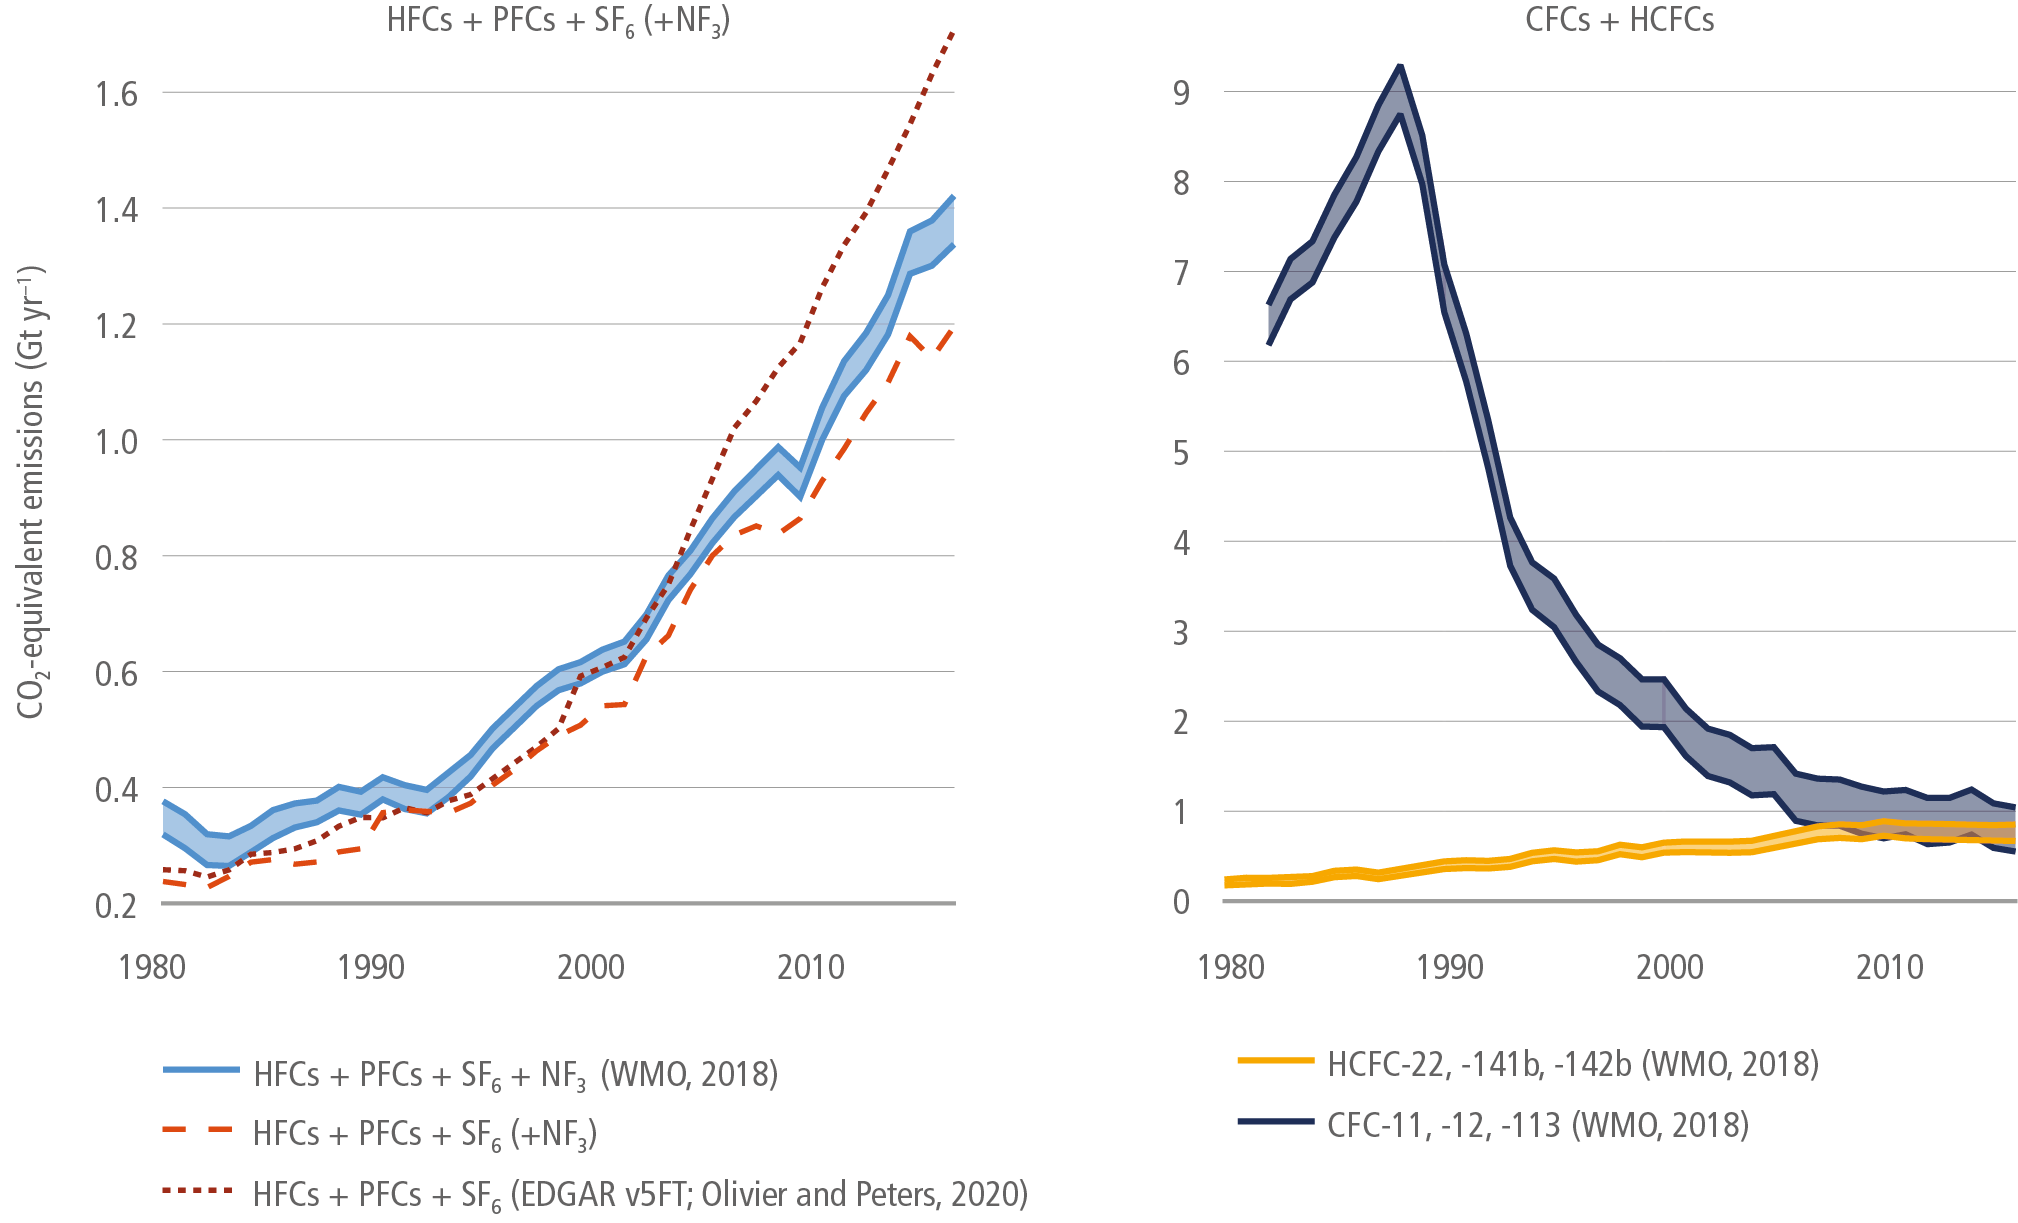
Figure caption
Figure 2.3 | Comparison between top-down estimates and bottom-up EDGAR inventory data on GHG emissions for 1980–2016. Left panel: Total GWP100-weighted emissions based on IPCC AR6 (Forster et al. 2021a) of F-gases in Olivier and Peters (2020) [EDGARv5FT] (dark-red dotted line, excluding C4F10, C5F12, C6F14 and C7F16) and EDGARv6 (bright red dashed line) compared to top-down estimates based on AGAGE and NOAA data from WMO (2018) (blue lines; Engel and Rigby (2018); Montzka and Velders (2018)). Right panel: Top-down aggregated emissions for the three most abundant CFCs (–11, –12 and –113) and HCFCs (–22, –141b, –142b) not covered in bottom-up emissions inventories are shown in dark blue and yellow. For top-down estimates the shaded areas between two respective lines represent 1σ uncertainties. Source: Minx et al. (2021).