Figure 2.4
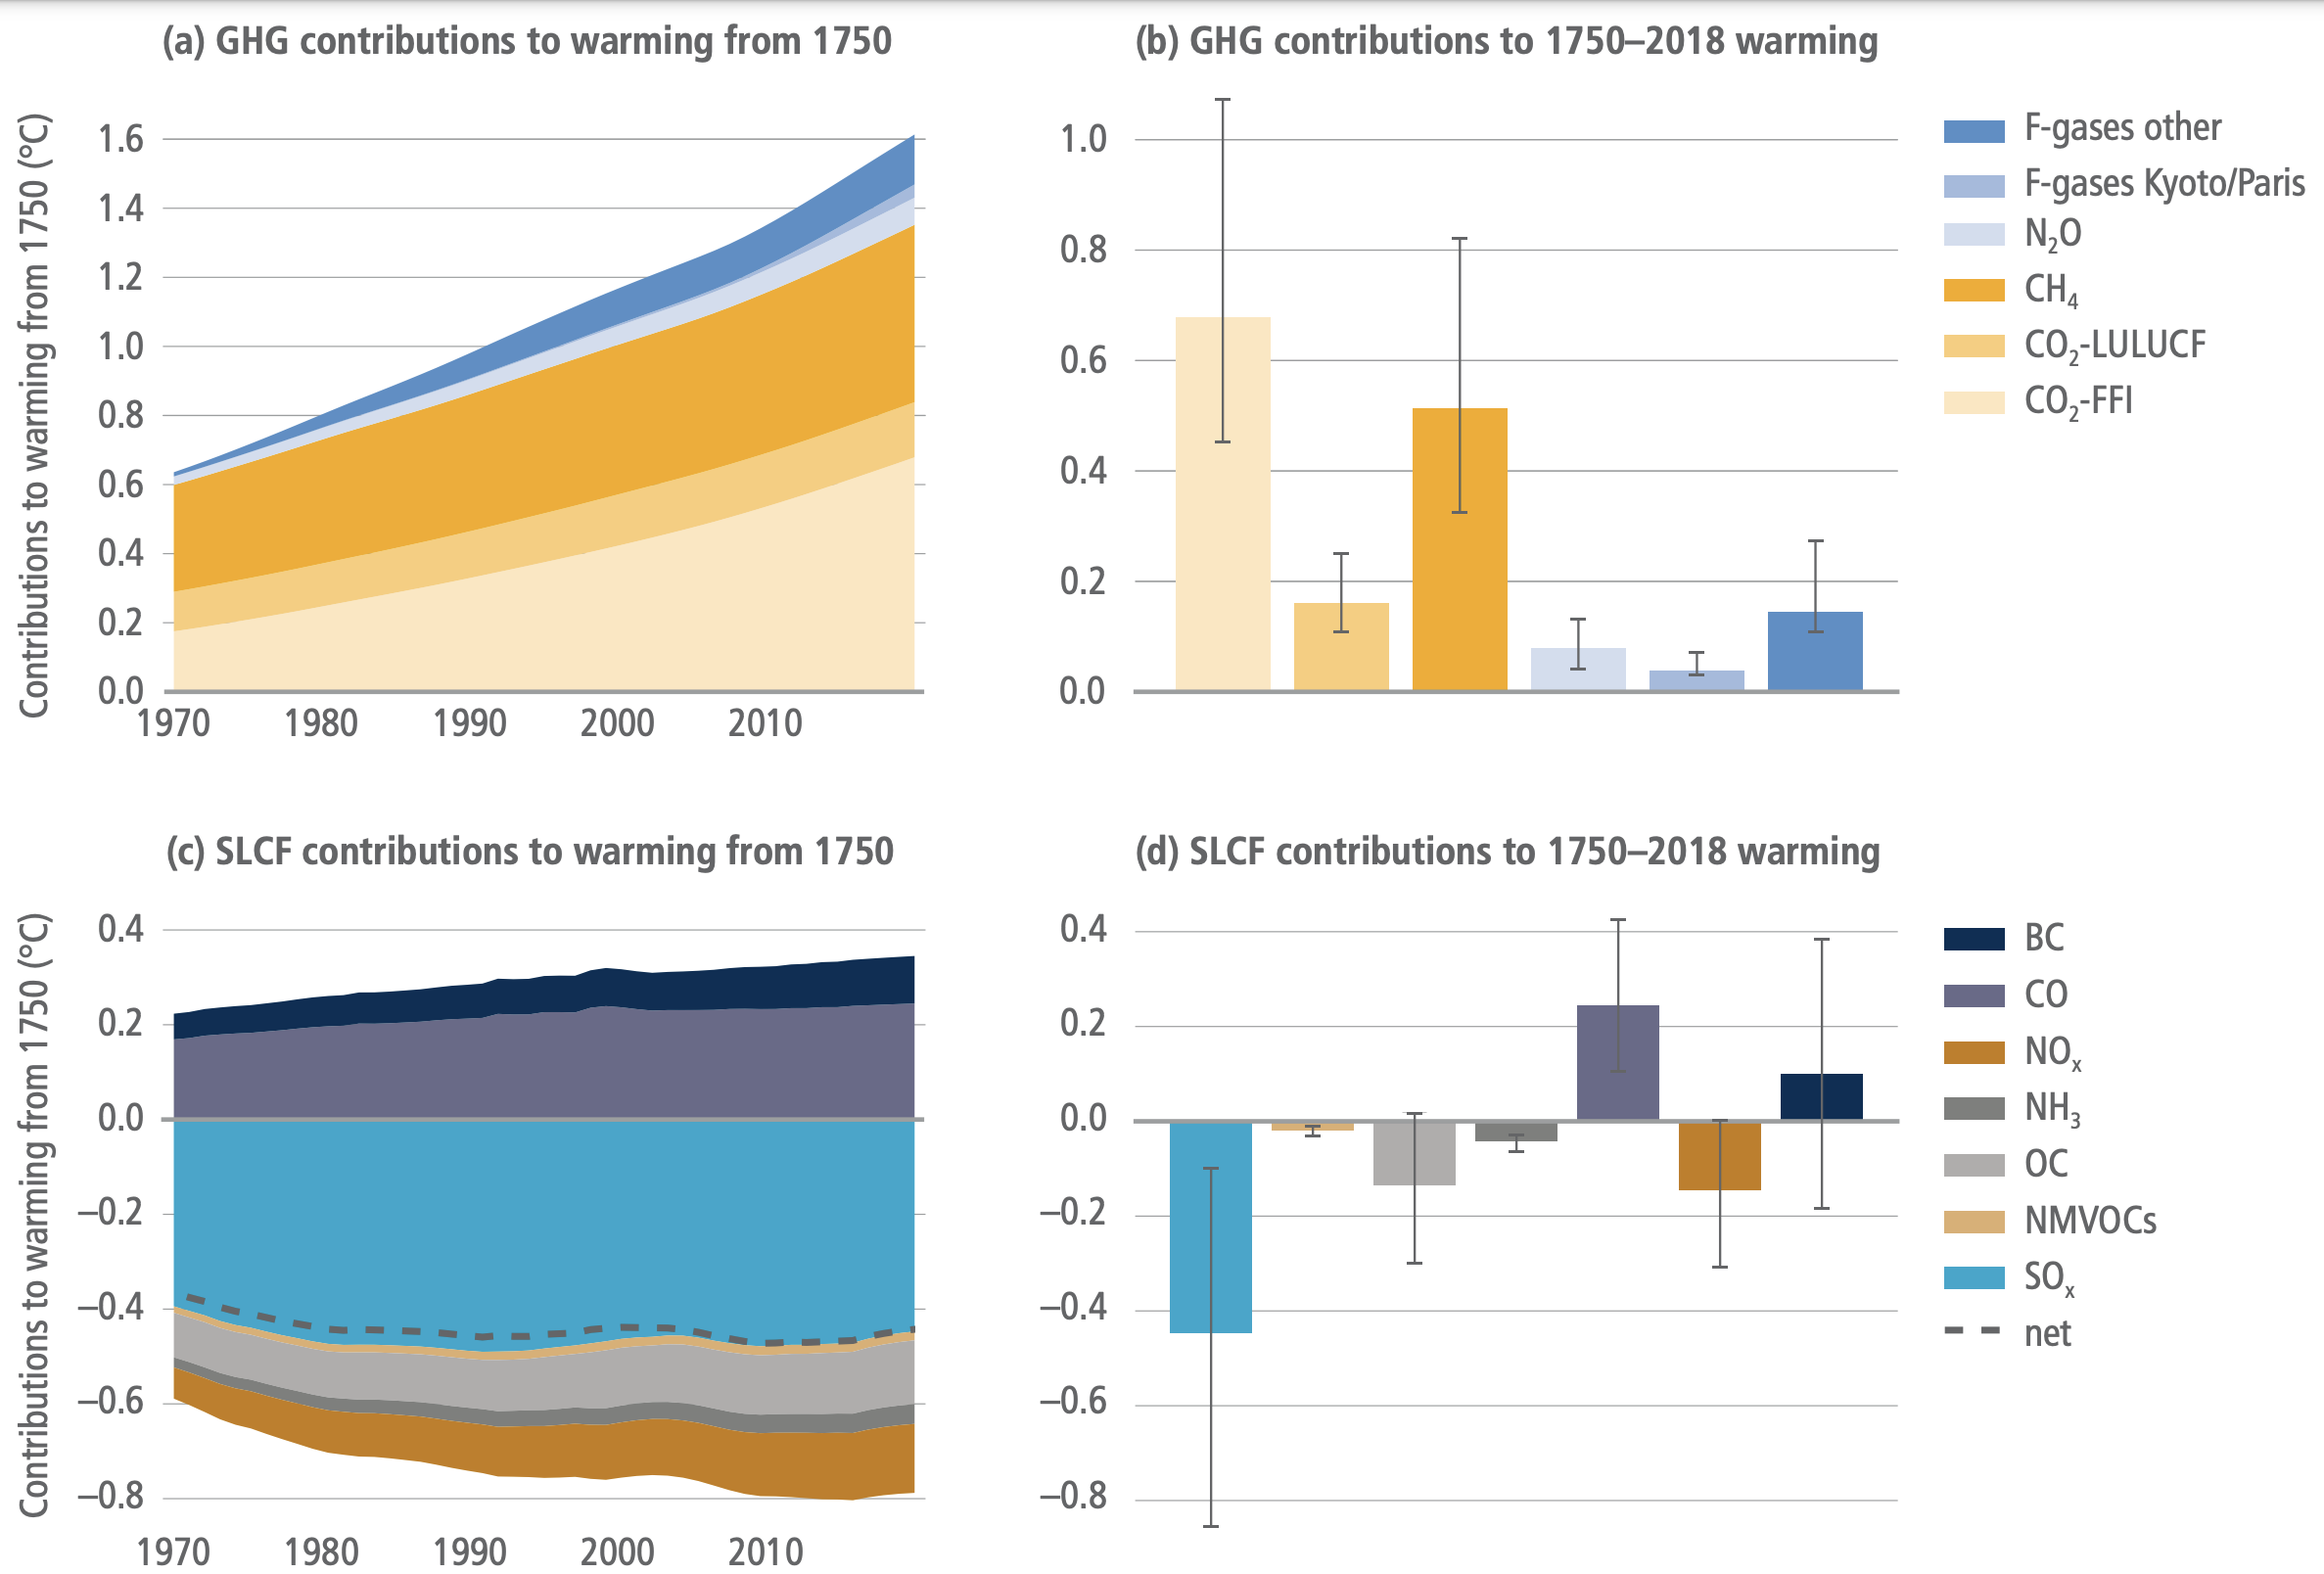
Figure caption
Figure 2.4 | Contribution of different GHGs to global warming over the period 1750 to 2018. Top row: contributions estimated with the FaIR reduced-complexity climate model. Major GHGs and aggregates of minor gases as a timeseries in (a) and as a total warming bar chart with 90% confidence interval added in (b). Bottom row: contribution from short-lived climate forcers as a time series in (c) and as a total warming bar chart with 90% confidence interval added in (d). The dotted line in (c) gives the net temperature change from short-lived climate forcers other than CH4. F-Kyoto/Paris includes the gases covered by the Kyoto Protocol and Paris Agreement, while F-other includes the gases covered by the Montreal Protocol but excluding the HFCs. Source: Minx et al. (2021).