Figure 2.5
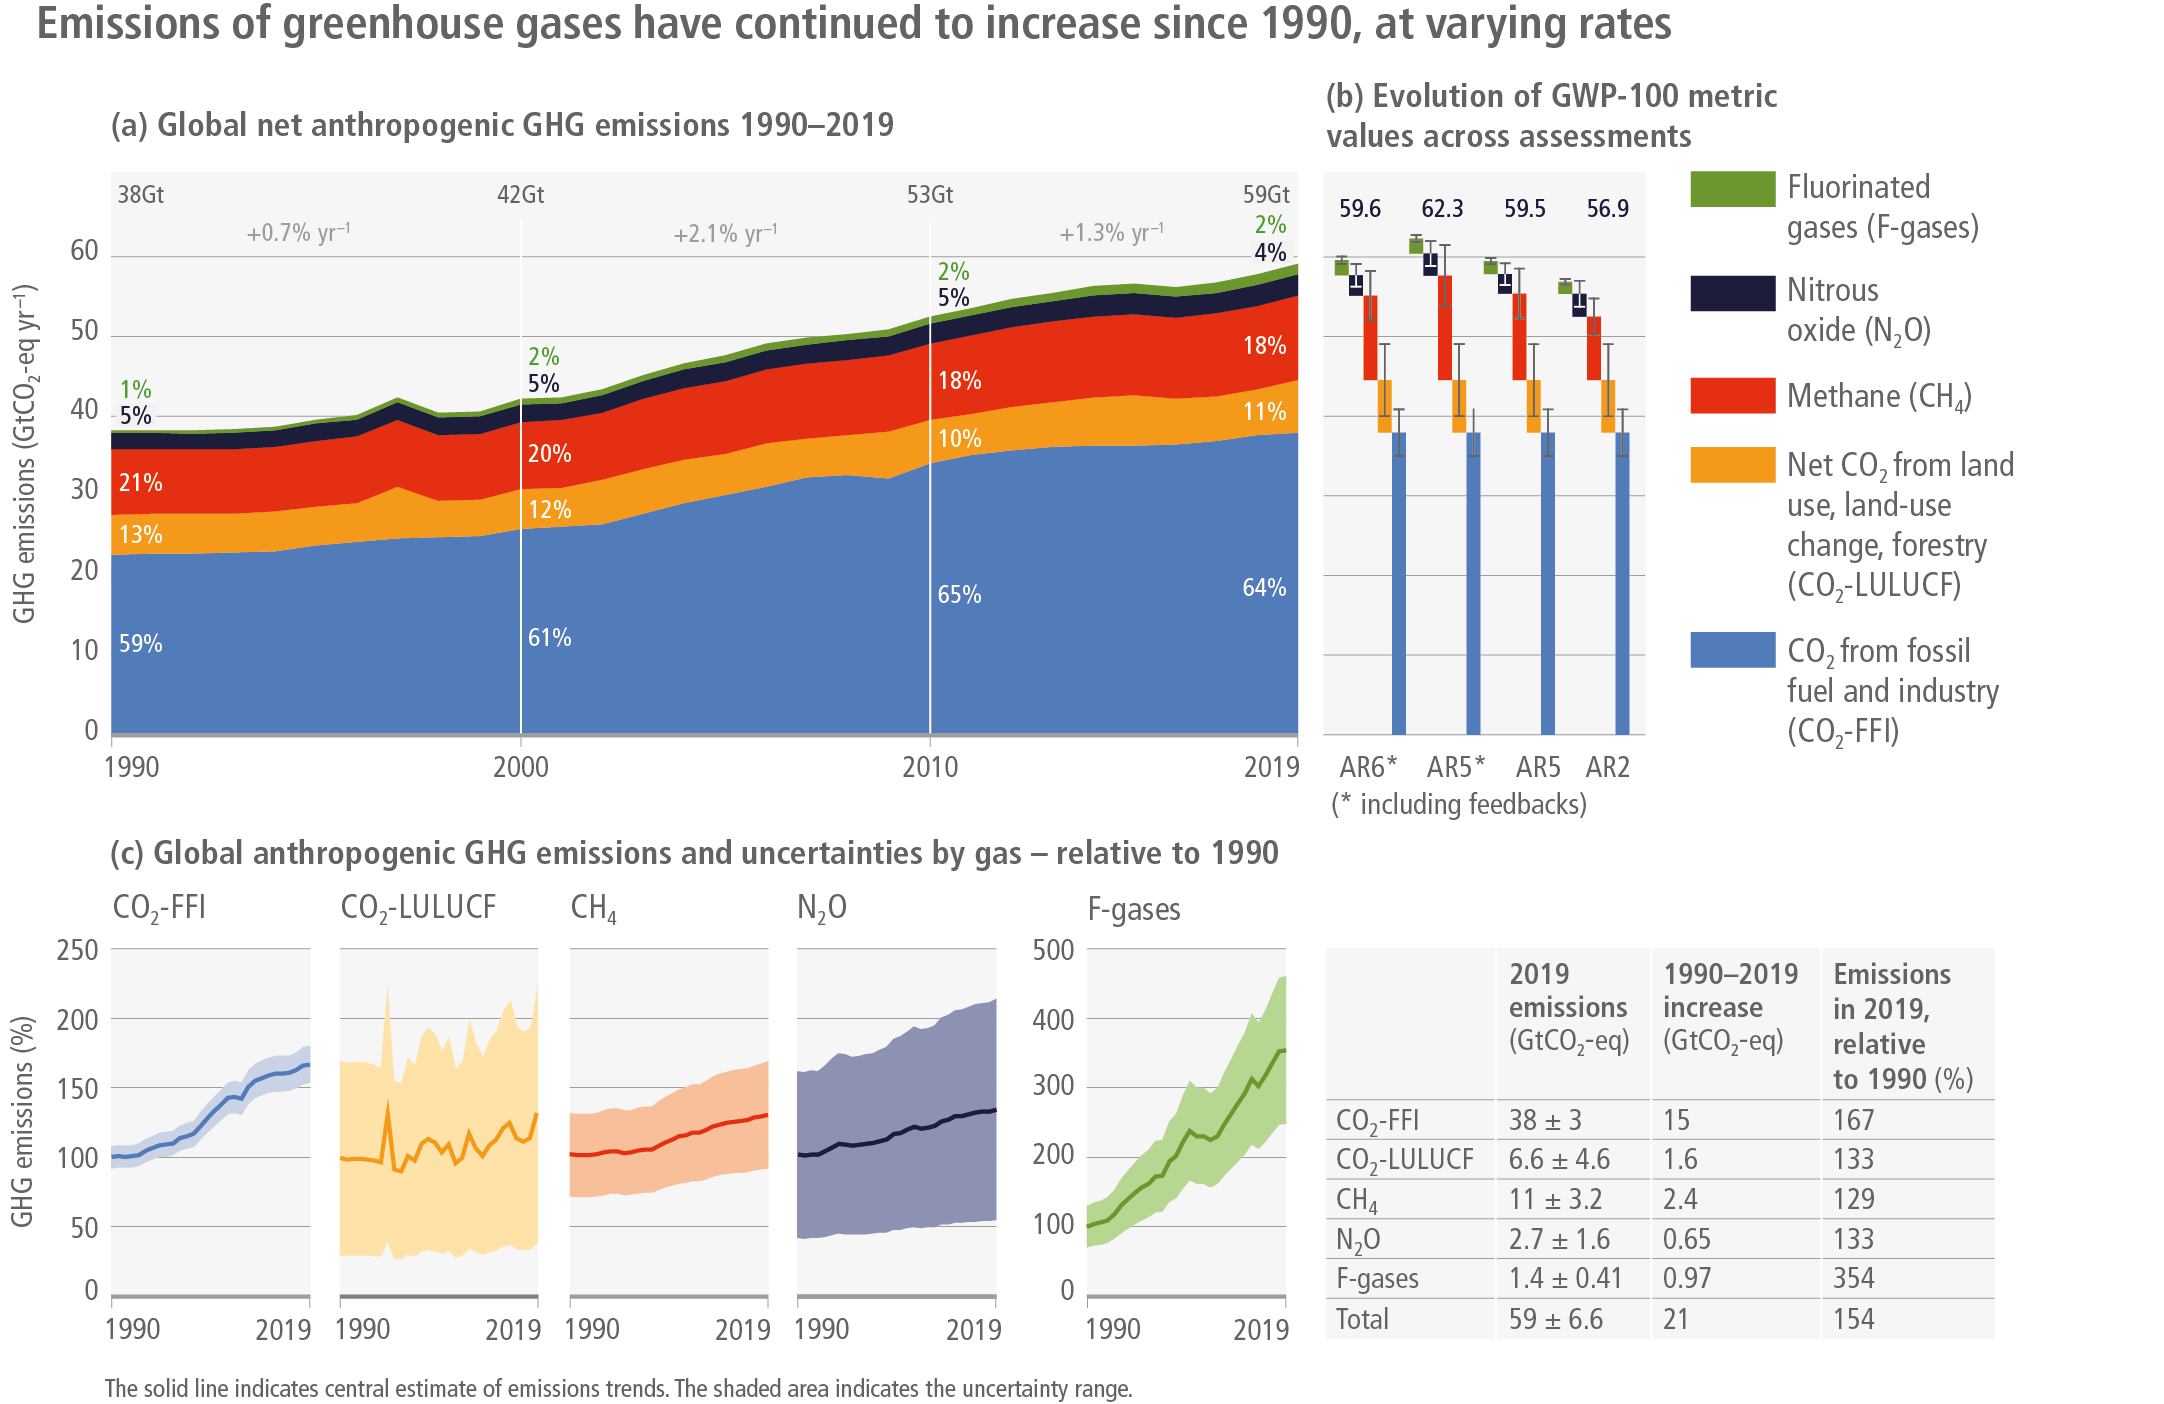
Figure caption
Figure 2.5 | Total anthropogenic GHG emissions (GtCO2-eq yr –1) 1990–2019. CO2 from fossil fuel combustion and industrial processes (FFI); net CO2 from land use, land use change and forestry (LULUCF); methane (CH4); nitrous oxide (N2O); fluorinated gases (F-gases: HFCs, PFCs, SF6, NF3). Panel (a): Aggregate GHG emissions trends by groups of gases reported in GtCO2-eq converted based on global warming potentials with a 100-year time horizon (GWP100) from the IPCC Sixth Assessment Report. Panel (b): Waterfall diagrams juxtaposes GHG emissions for the most recent year (2019) in CO2 equivalent units using GWP100 values from the IPCC’s Second, Fifth, and Sixth Assessment Reports, respectively. Error bars show the associated uncertainties at a 90% confidence interval. Panel (c): individual trends in CO2-FFI, CO2-LULUCF, CH4, N2O and F-gas emissions for the period 1990–2019, normalised to 1 in 1990. Source: data from Minx et al. (2021).