Box 3.4, Figure 1
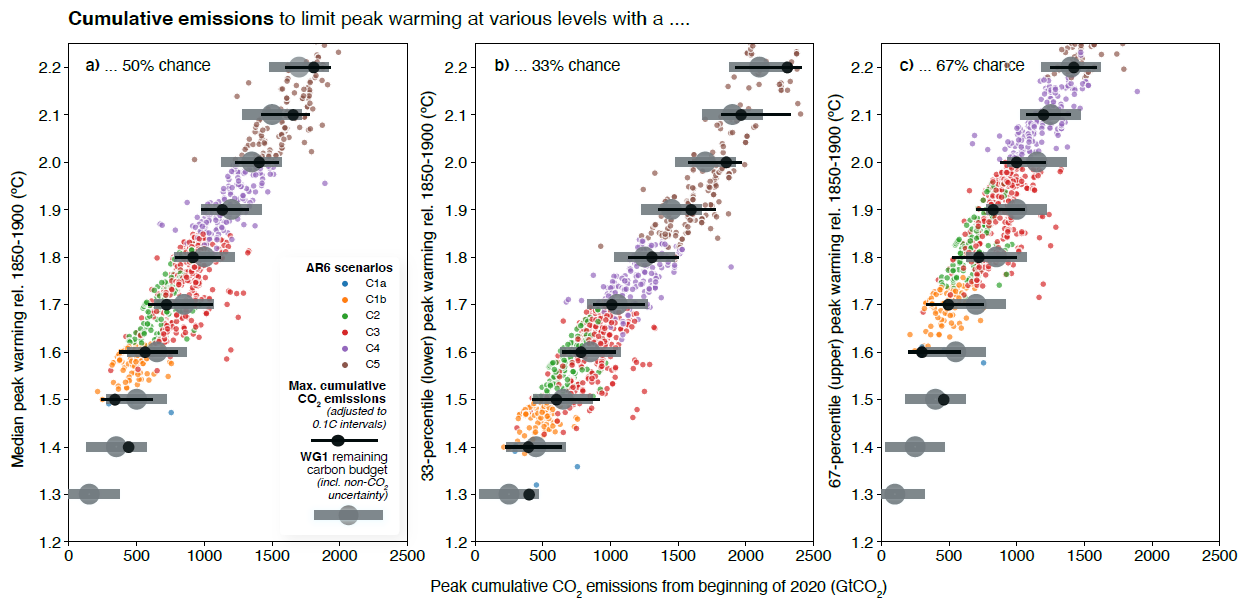
Figure caption
Box 3.4, Figure 1 | Cumulative CO2 emissions from AR6 scenario categories (coloured dots), adjusted for distinct 0.1°C warming levels (black bars) in comparison to the WGI remaining carbon budgets (grey bars). The cumulative carbon emissions for the AR6 scenarios are shown for the median peak warming (a), the 33rd-percentile peak warming (b) and the upper 67th-percentile peak warming (c) calculated with the WGI-calibrated emulator MAGICC7 (IPCC AR6 WGI, Cross-Chapter Box 7.1). The adjustment to the nearest 0.1°C intervals is made using AR6 WGI TCRE (at the relevant percentile, e.g., the 67th-percentile TCRE is used to adjust the 67th-percentile peak warming), with the 5–95% range of adjusted scenarios provided by the black bar. The AR6 WGI remaining carbon budget is shown, including the WGI estimate of at least a ±220 GtCO2 uncertainty due to non-CO2 emissions variations across scenarios (grey bars). For median peak warming (panel a) projections below 2°C relative to 1850–1900, the AR6 WGIII assessment of cumulative carbon emissions tends to be slightly smaller than the remaining carbon budgets provided by WGI but well within the uncertainties. Note that only a few scenarios in WGIII limit warming to below 1.5°C with a 50% chance, thus statistics for that specific threshold have low confidence.