Box 3.4, Figure 2
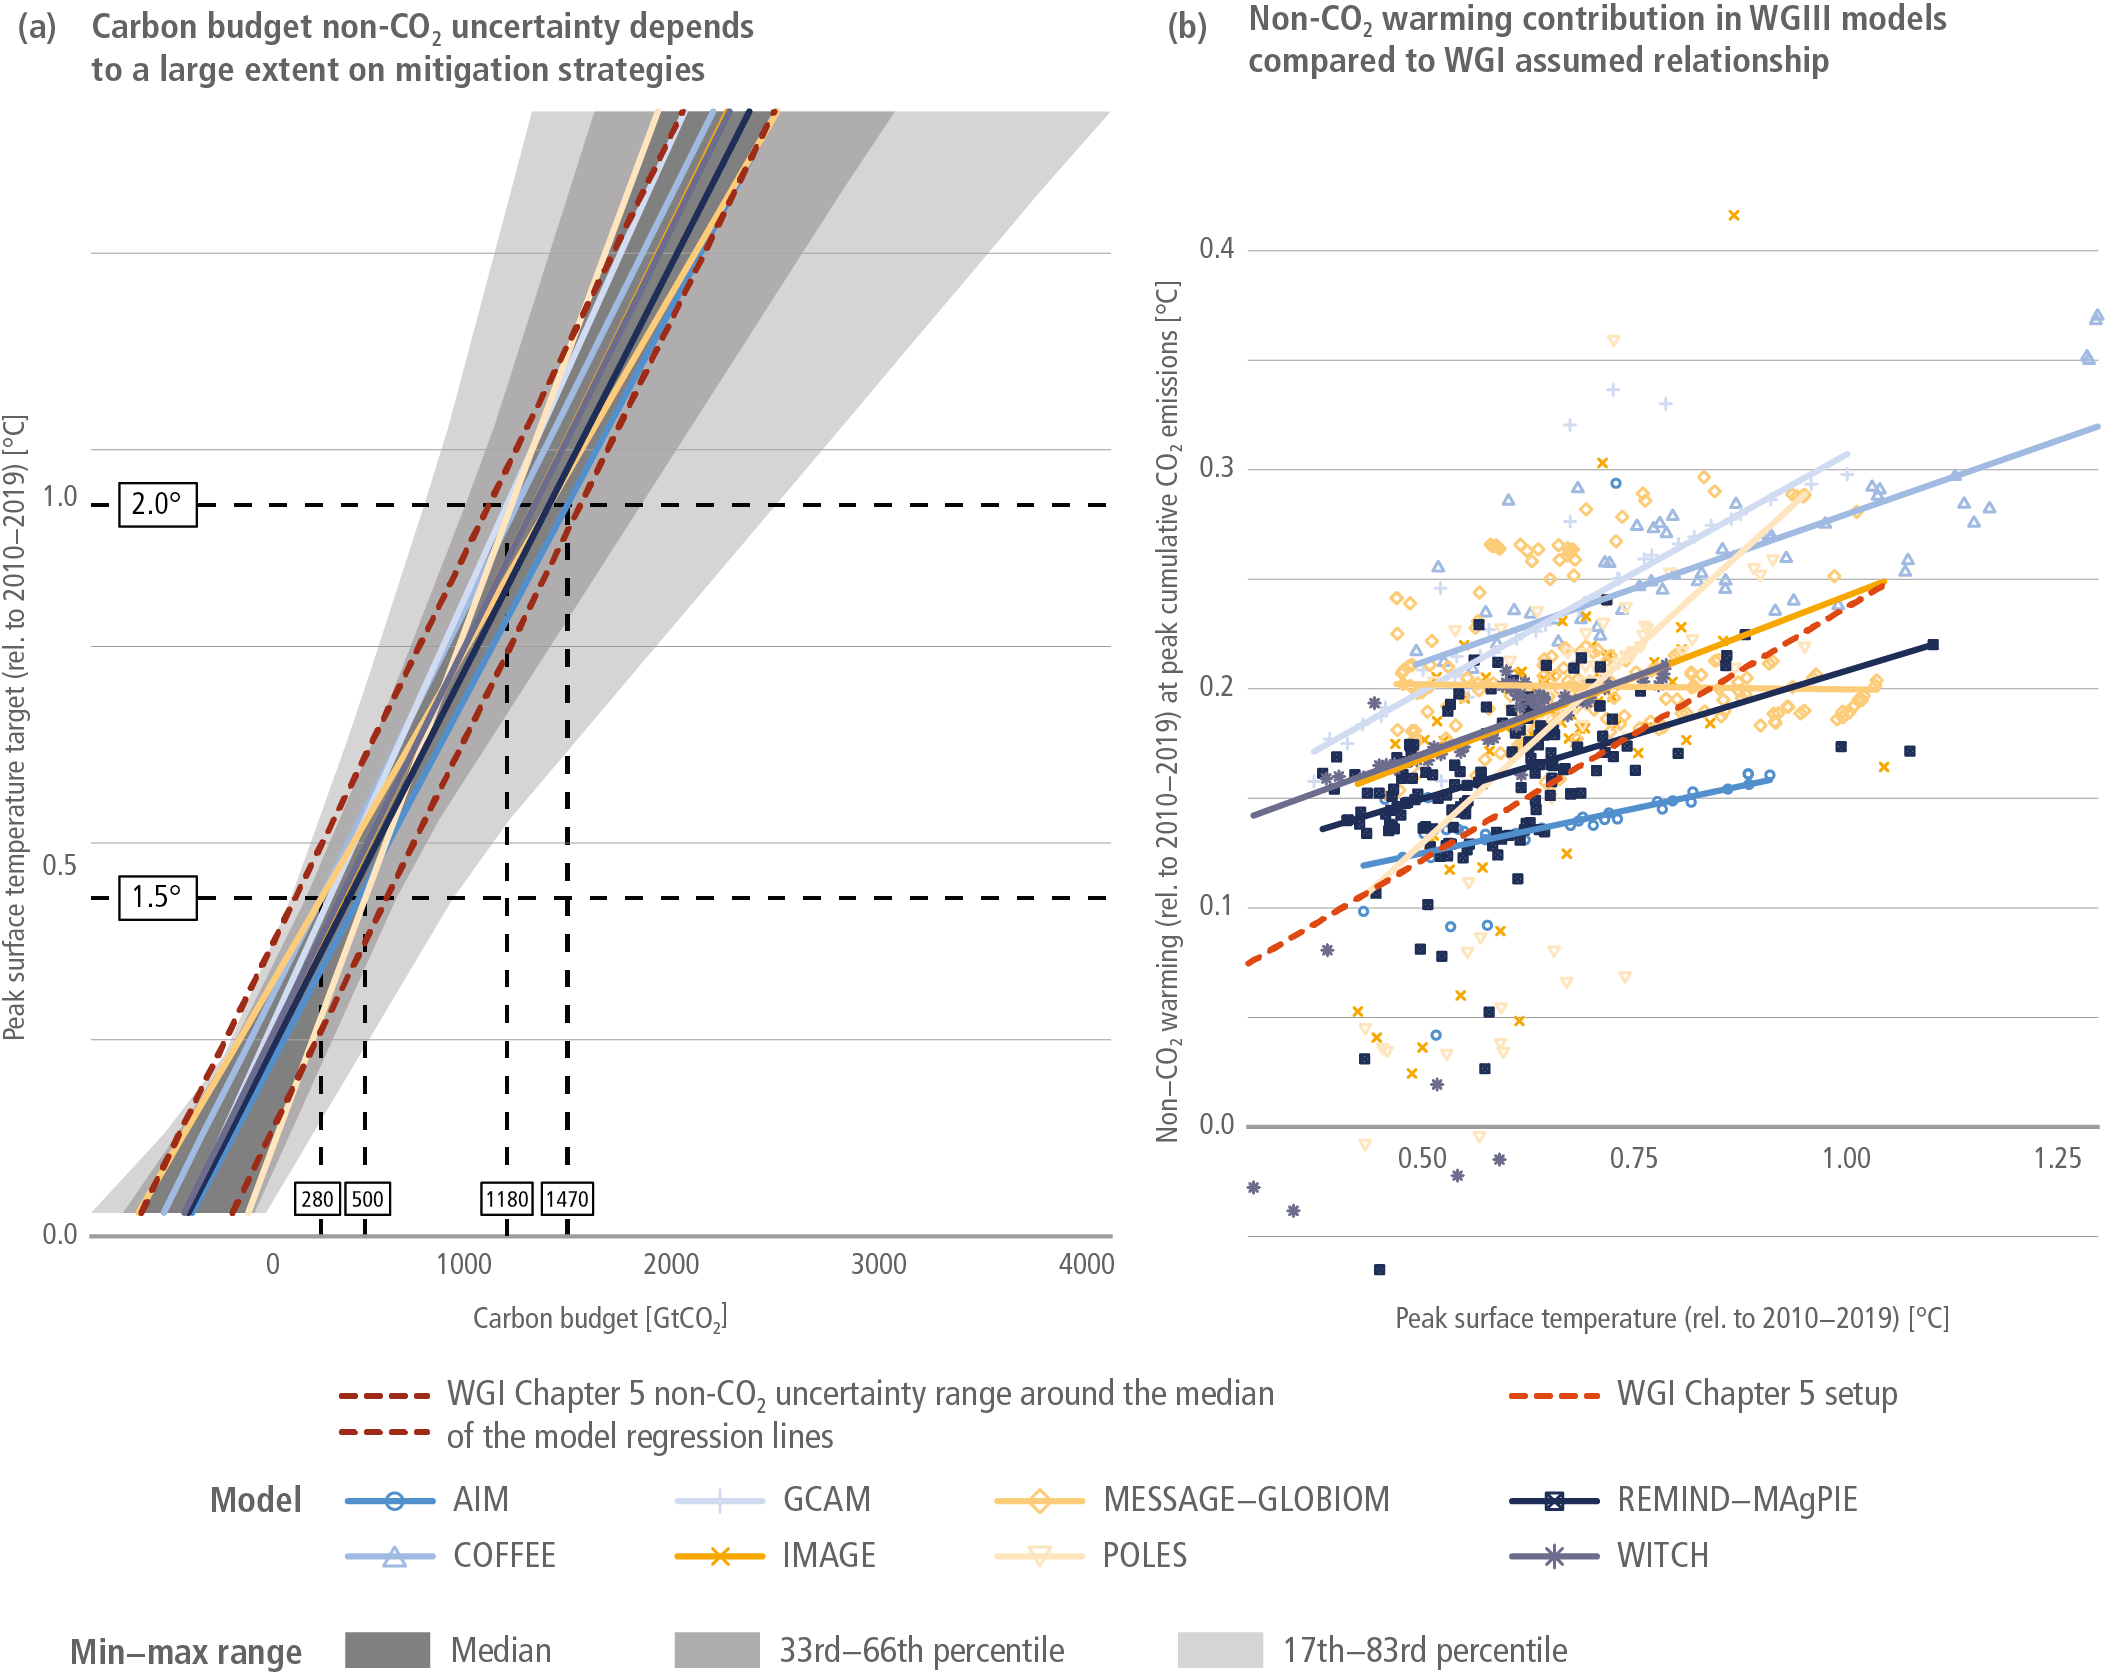
Figure caption
Box 3.4, Figure 2 | (a) Differences in regressions of the relationship between peak surface temperature and associated cumulative CO2 emissions from 2020 derived from scenarios of eight integrated assessment model frameworks. The coloured lines show the regression at median for scenarios of the eight modelling frameworks, each with more than 20 scenarios in the database and a detailed land-use representation. The red dotted lines indicate the non-CO2 uncertainty range of AR6 WGI Chapter 5 (±220 GtCO2), here visualised around the median of the eight model framework lines. Carbon budgets from 2020 until 1.5°C (0.43K above 2010–2019 levels) and 2.0°C (0.93K above 2010–2019 levels) are shown for minimum and maximum model estimates at the median, rounded to the nearest 10 GtCO2. Panel (b) shows the relationship between the estimated non-CO2 warming in mitigation scenarios that reach net zero and the associated peak surface temperature outcomes. The coloured lines show the regression at median for scenarios of the eight modelling frameworks with more than 20 scenarios in the database and a detailed land-use representation. The black dashed line indicates the non-CO2 relationship based on the scenarios and climate emulator setup as was assessed in AR6 WGI Chapter 5.