Back to chapter figures
Cross-Chapter Box 3, Figure 1
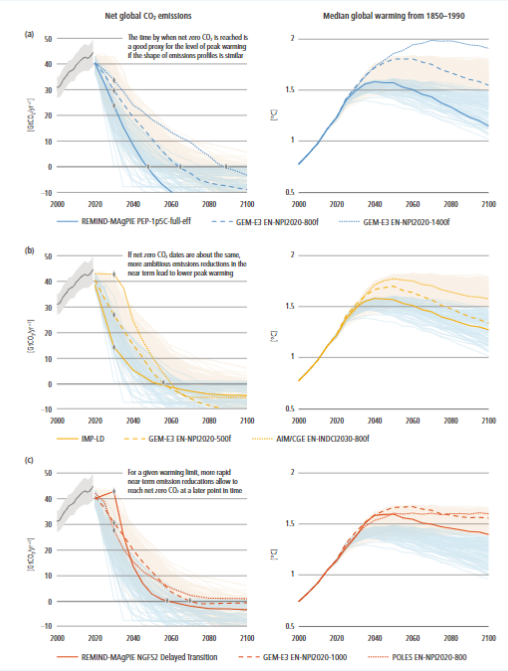
Figure caption
Cross-Chapter Box 3, Figure 1 | Selected global CO2 emissions trajectories with similar shape and different net zero CO2 date (a), different shape and similar net zero CO2 date (b), and similar peak warming, but varying shapes and net zero CO2 dates (c). Funnels show pathways limiting warming to 1.5°C (>50%) with no or limited overshoot (light blue) and limiting warming to 2°C (>67%) (beige). Historic CO2 emissions from Section 2.2 (EDGAR v6).