Cross-Working Group Box 1, Figure 1
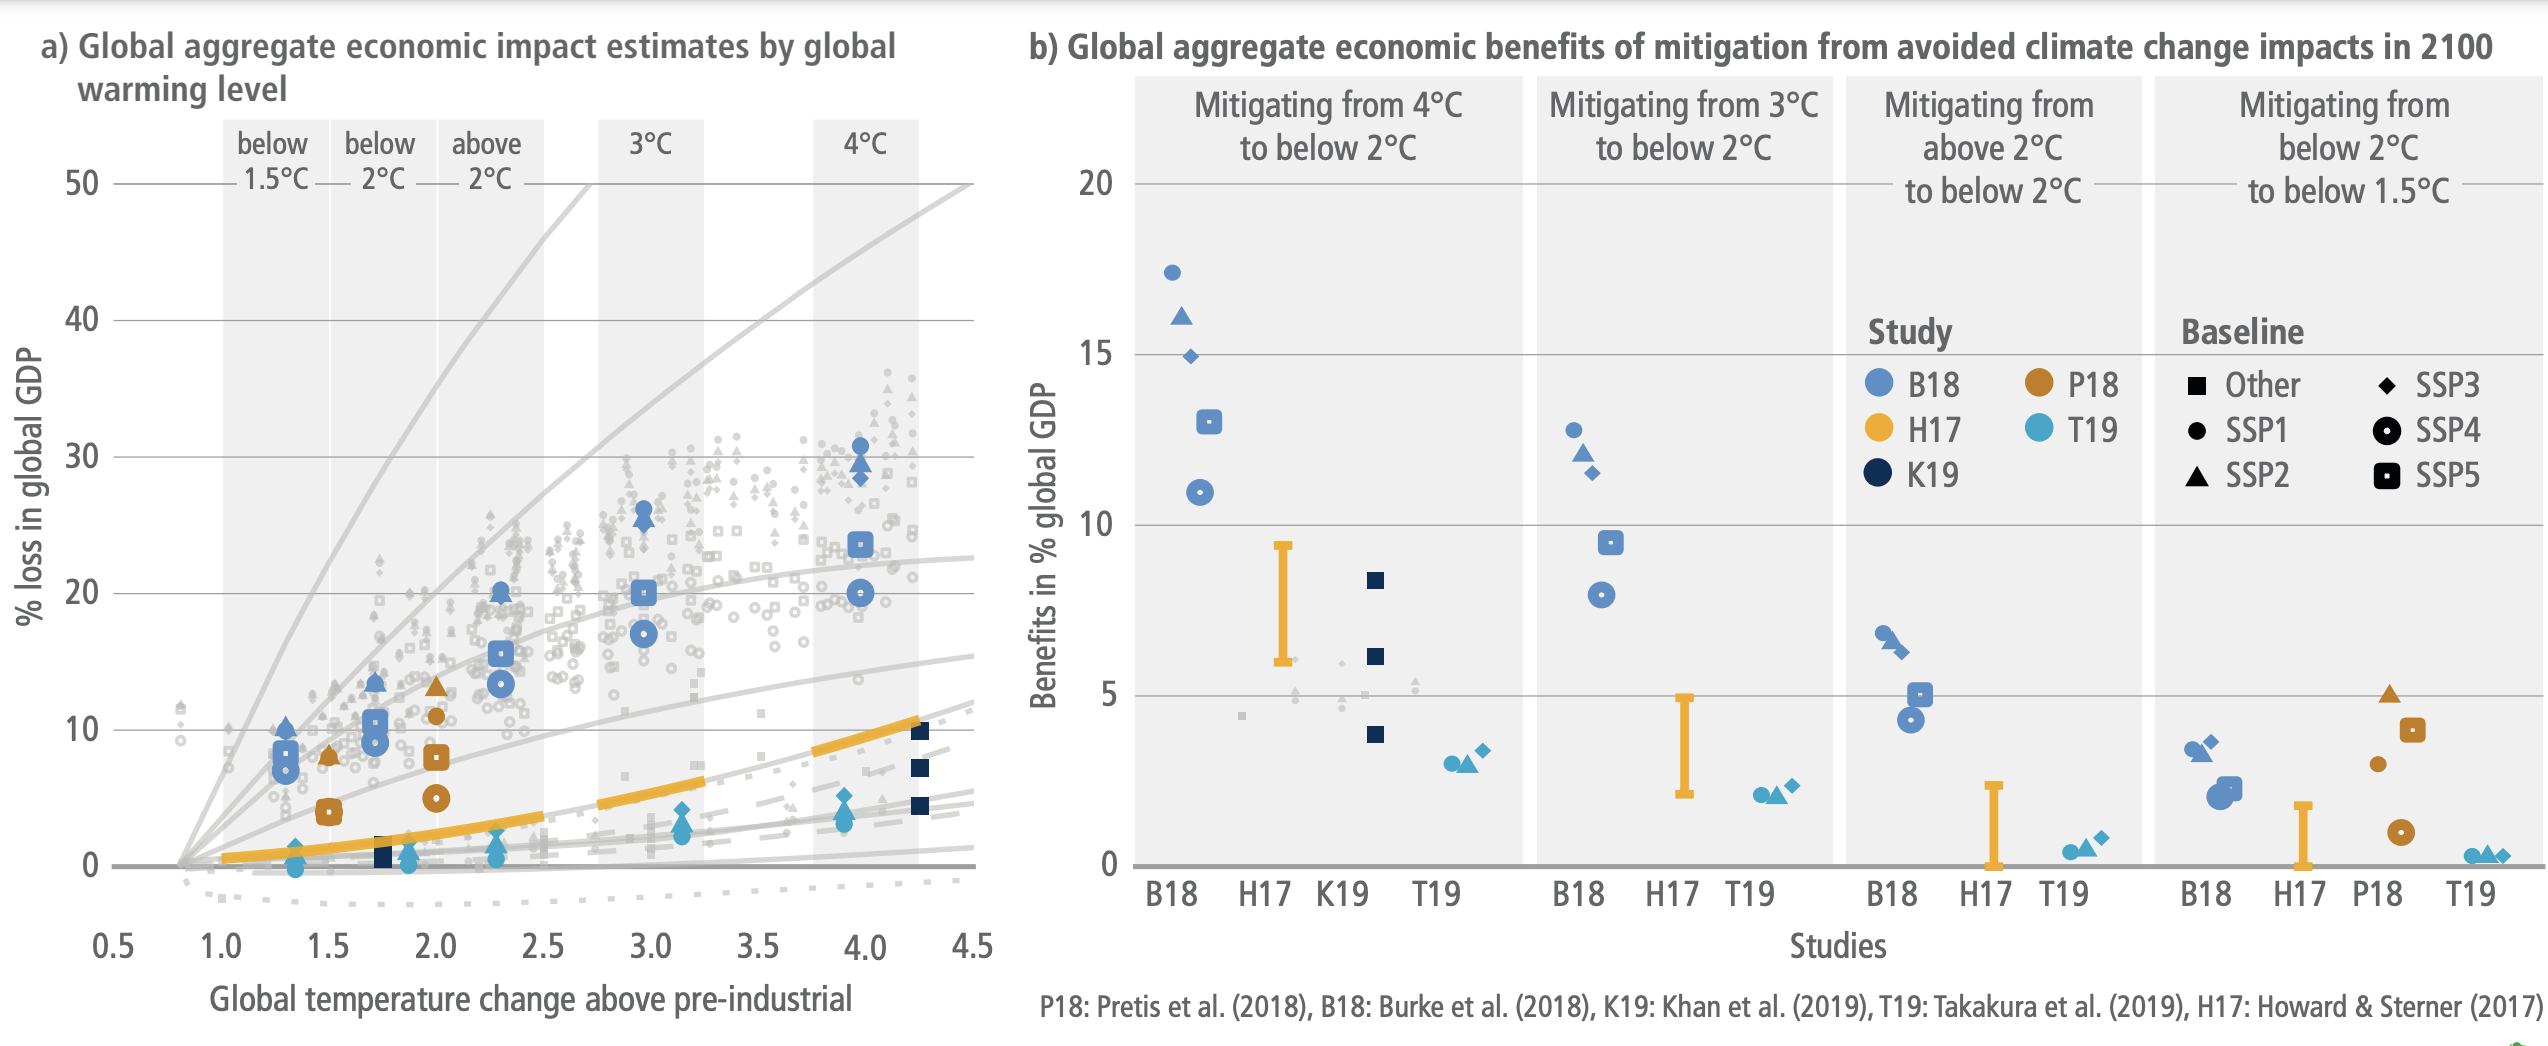
Figure caption
Cross-Working Group Box 1, Figure 1 | Global aggregate economic benefits of mitigation from avoided climate change impacts in 2100 corresponding to shifting from a higher temperature category (4°C (3.75°C–4.25°C), 3°C (2.75°C–3.25°C), or above 2°C (2°C–2.5°C), to below 2°C (1.5°C–2°C), as well as from below 2°C to below 1.5°C (1°C–1.5°C)), from the five studies discussed in the text. Panel (a) is adapted from AR6 WGII Cross-Working Group Box ECONOMIC, Figure 1, showing global aggregate economic impact estimates (% global GDP loss relative to GDP without additional climate change) by temperature change level. All estimates are shown in grey. Estimates used for the computation of estimated benefits in 2100 in panel (b) are coloured for the selected studies, which provide results for different temperature change levels. See the AR6 WGII AR6 WGII Cross-Working Group Box ECONOMIC for discussion and assessment of the estimates in panel (a) and the differences in methodologies. For B18 and T19, median estimates in the cluster are considered. Shape distinguishes the baseline scenarios. Temperature ranges are highlighted. HS17 estimates are based on their preferred model –50th percentile of non-catastrophic damage. Panel (b) shows the implied aggregate economic benefits in 2100 of a lower temperature increase. Economic benefits for point estimates are computed as a difference, while economic benefits from the curve HS17 are computed as ranges from the segment differences.