Back to chapter figures
Figure 3.11
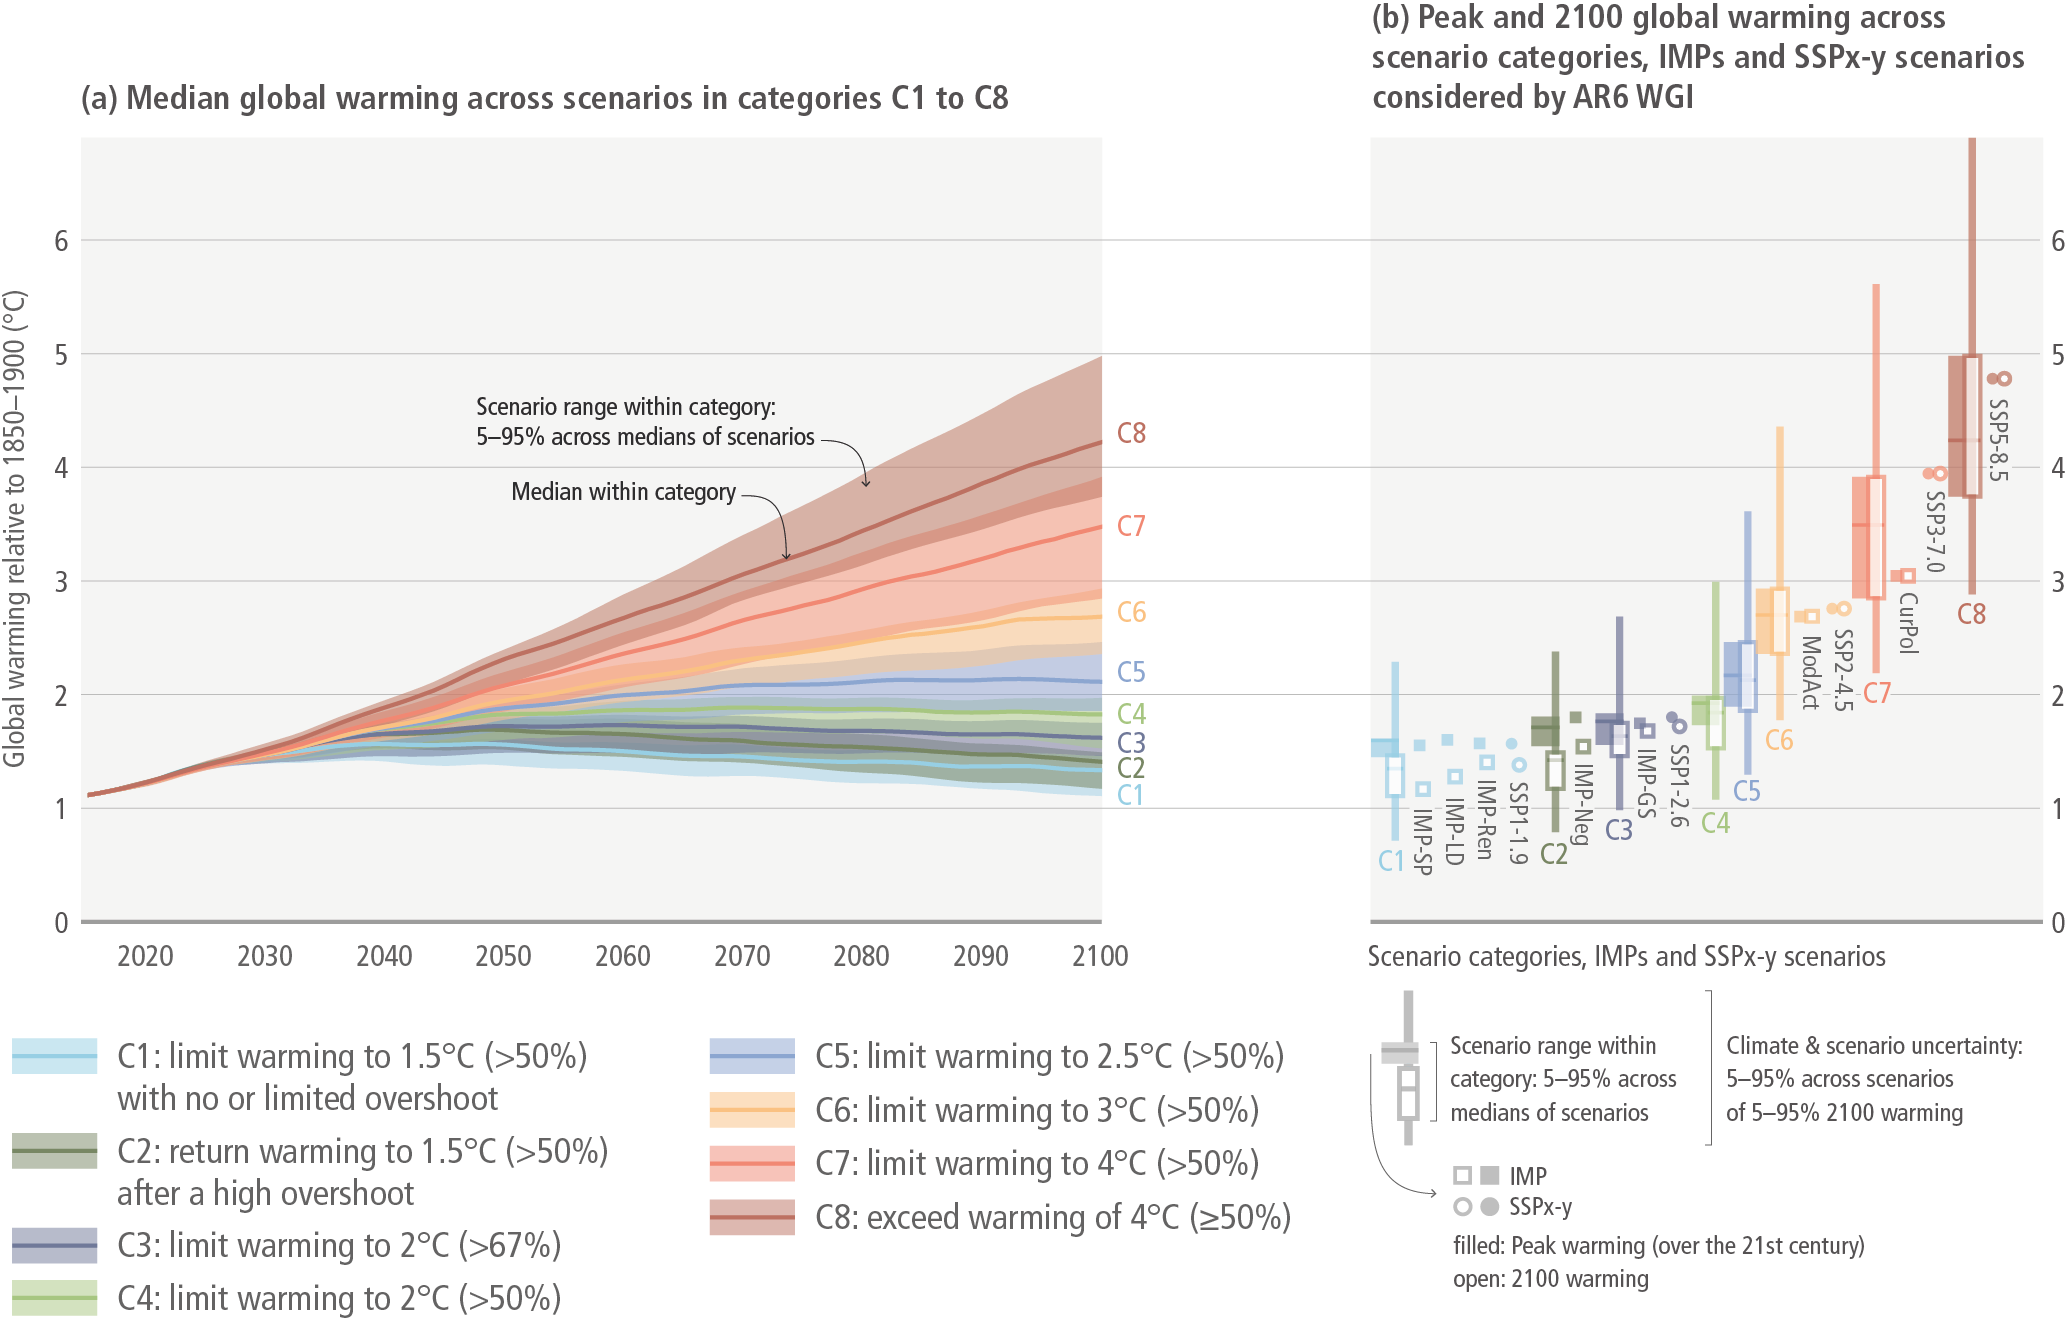
Figure caption
Figure 3.11 | Global mean temperature outcome of the ensemble of scenarios included in the climate categories C1–C8 (based on a reduced complexity model – RCM – calibrated to the WGI assessment, both in terms of future and historic warming). The left panel shows the ranges of scenario uncertainty (shaded area) with the P50 RCM probability (line). The right panel shows the P5 to P95 range of combined RCM climate uncertainty (C1–C8 is explained in Table 3.1) and scenario uncertainty, and the P50 (line).