Back to chapter figures
Figure 3.12
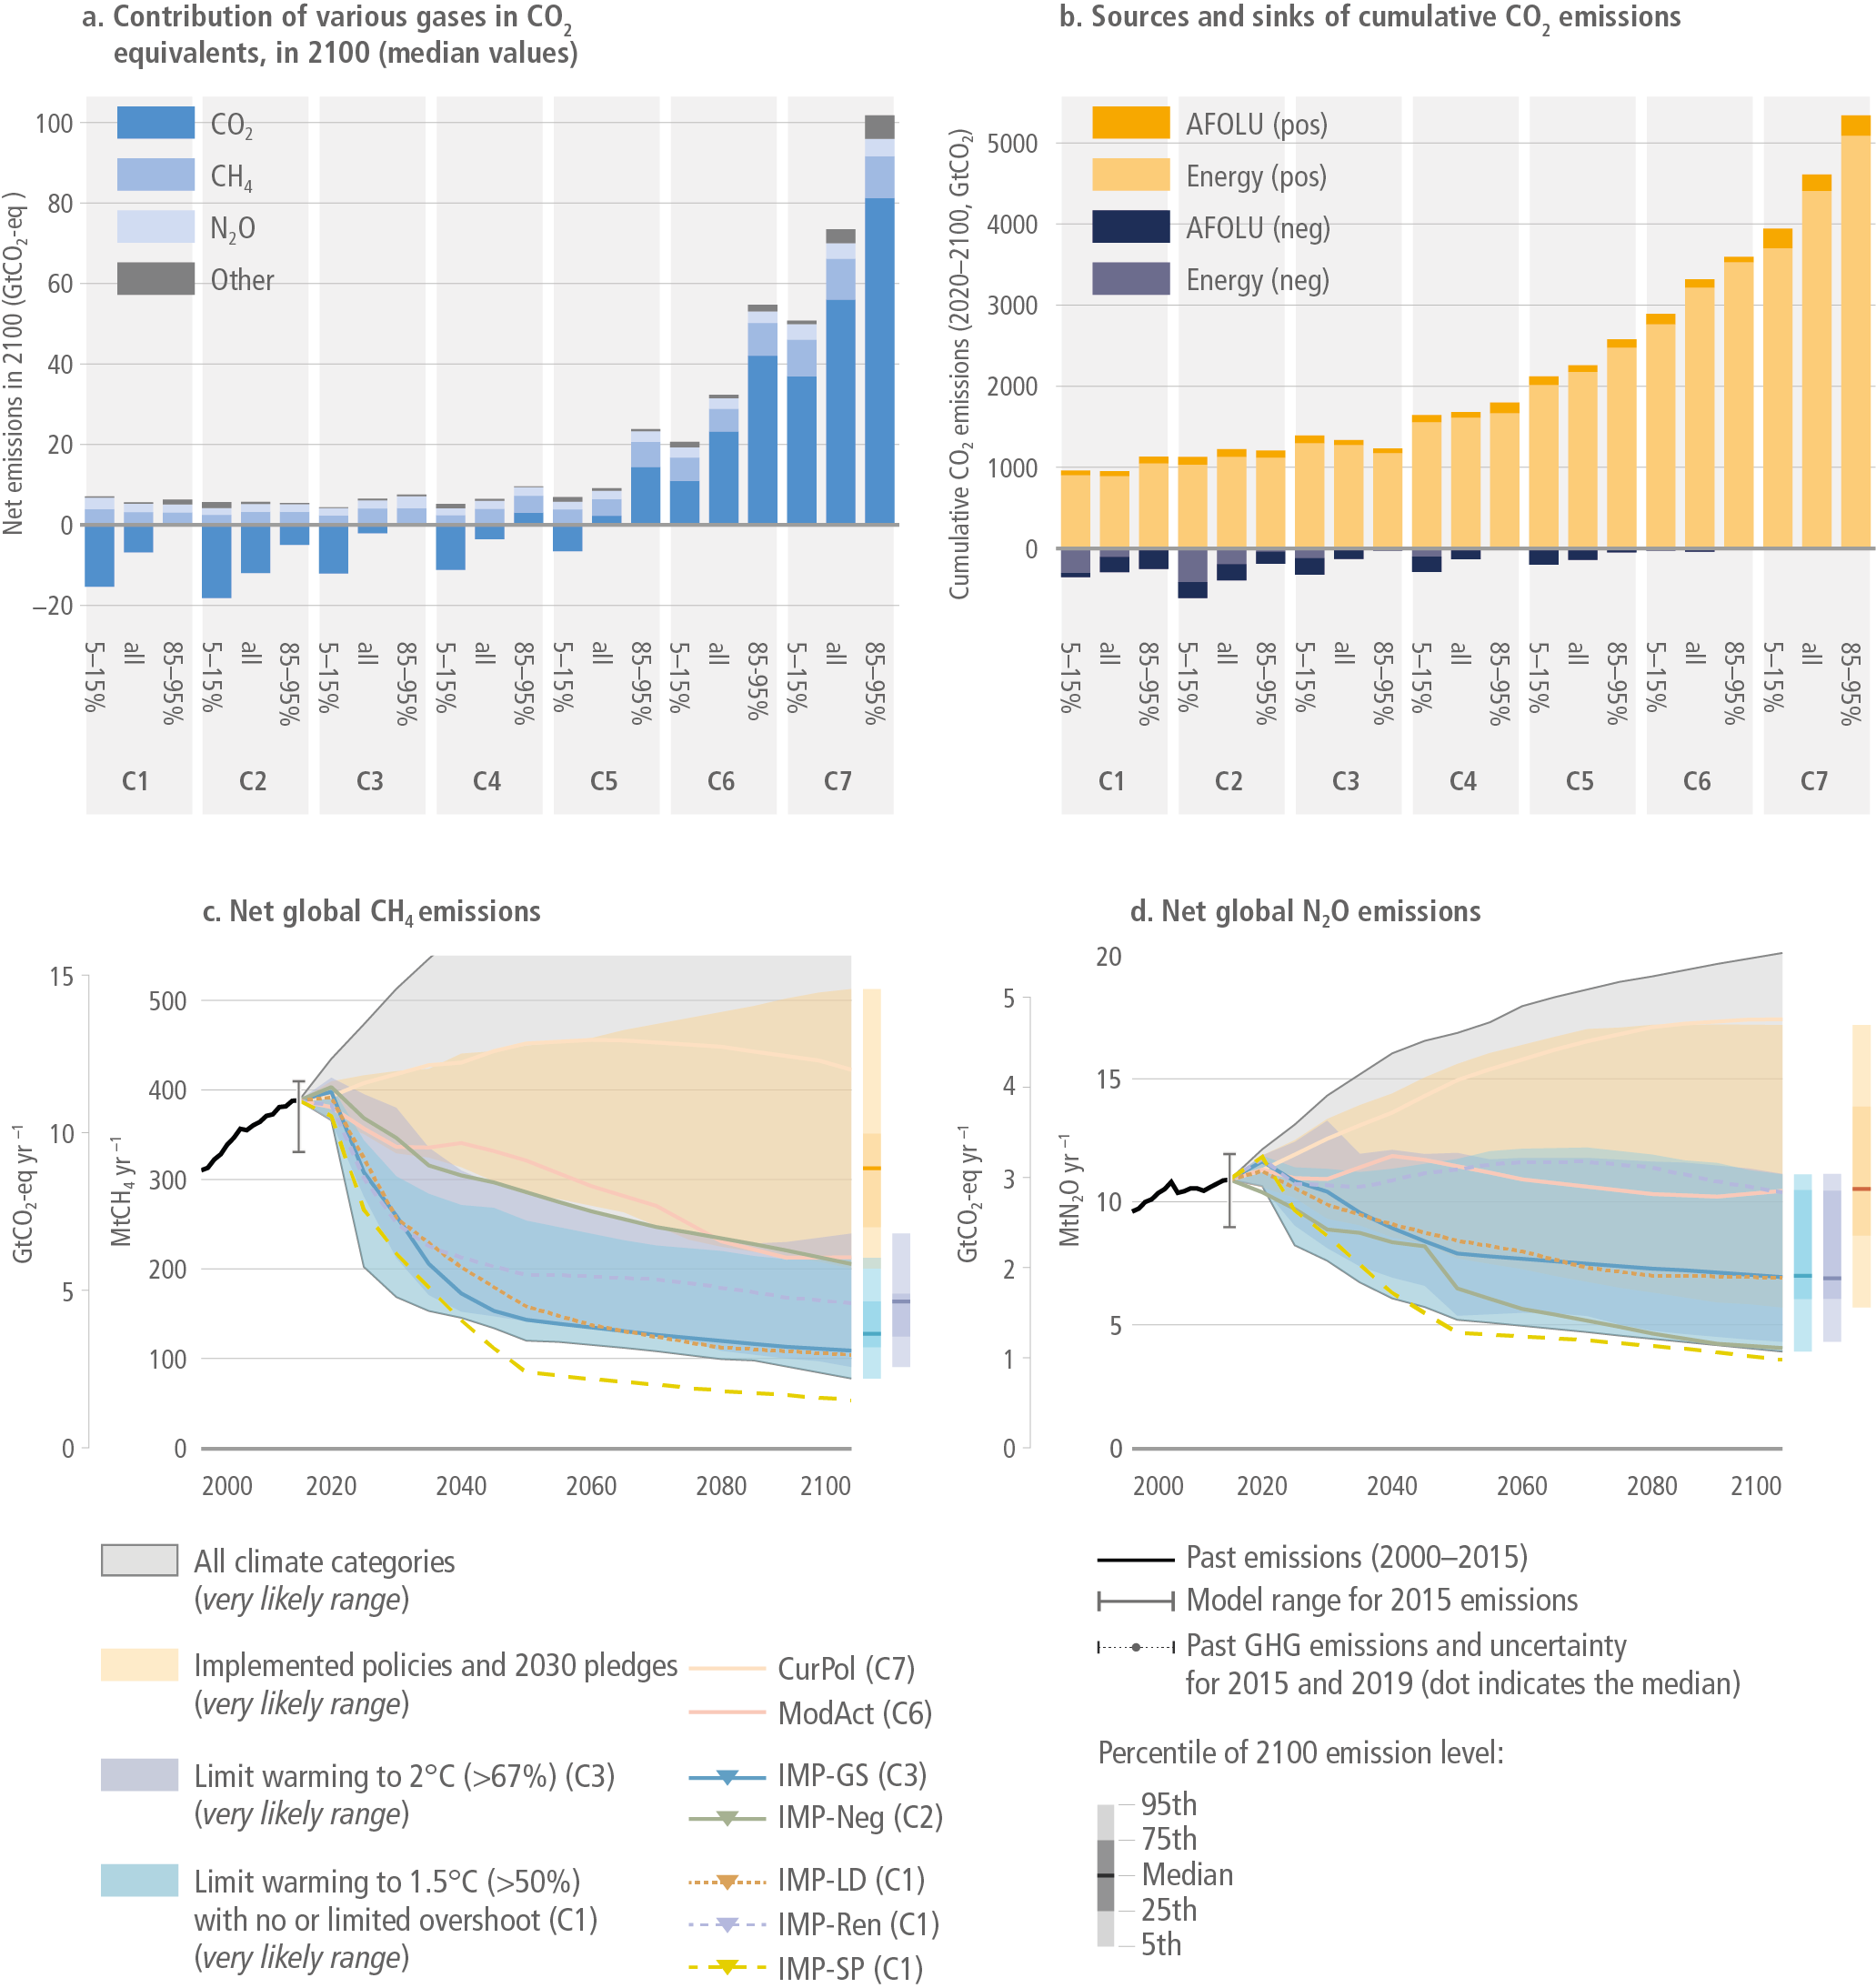
Figure caption
Figure 3.12 | (a) The role of CO2 and other greenhouse gases. Emission in CO2-eq in 2100 (using AR6 GWP-100) (other = halogenated gases) and (b) cumulative CO2 emissions in the 2020–2100 period. Panels (c) and (d) show the development of CH4 and N2O emissions over time. Energy emissions include the contribution of BECCS. For both energy and AFOLU sectors, the positive and negative values represent the cumulated annual balances. In both panels, the three bars per scenario category represent the lowest 5–15th percentile, the average value and the highest 5–15th percentile. These illustrate the range of scenarios in each category. The definition of C1–C7 can be found in Table 3.1.