Back to chapter figures
Figure 3.13
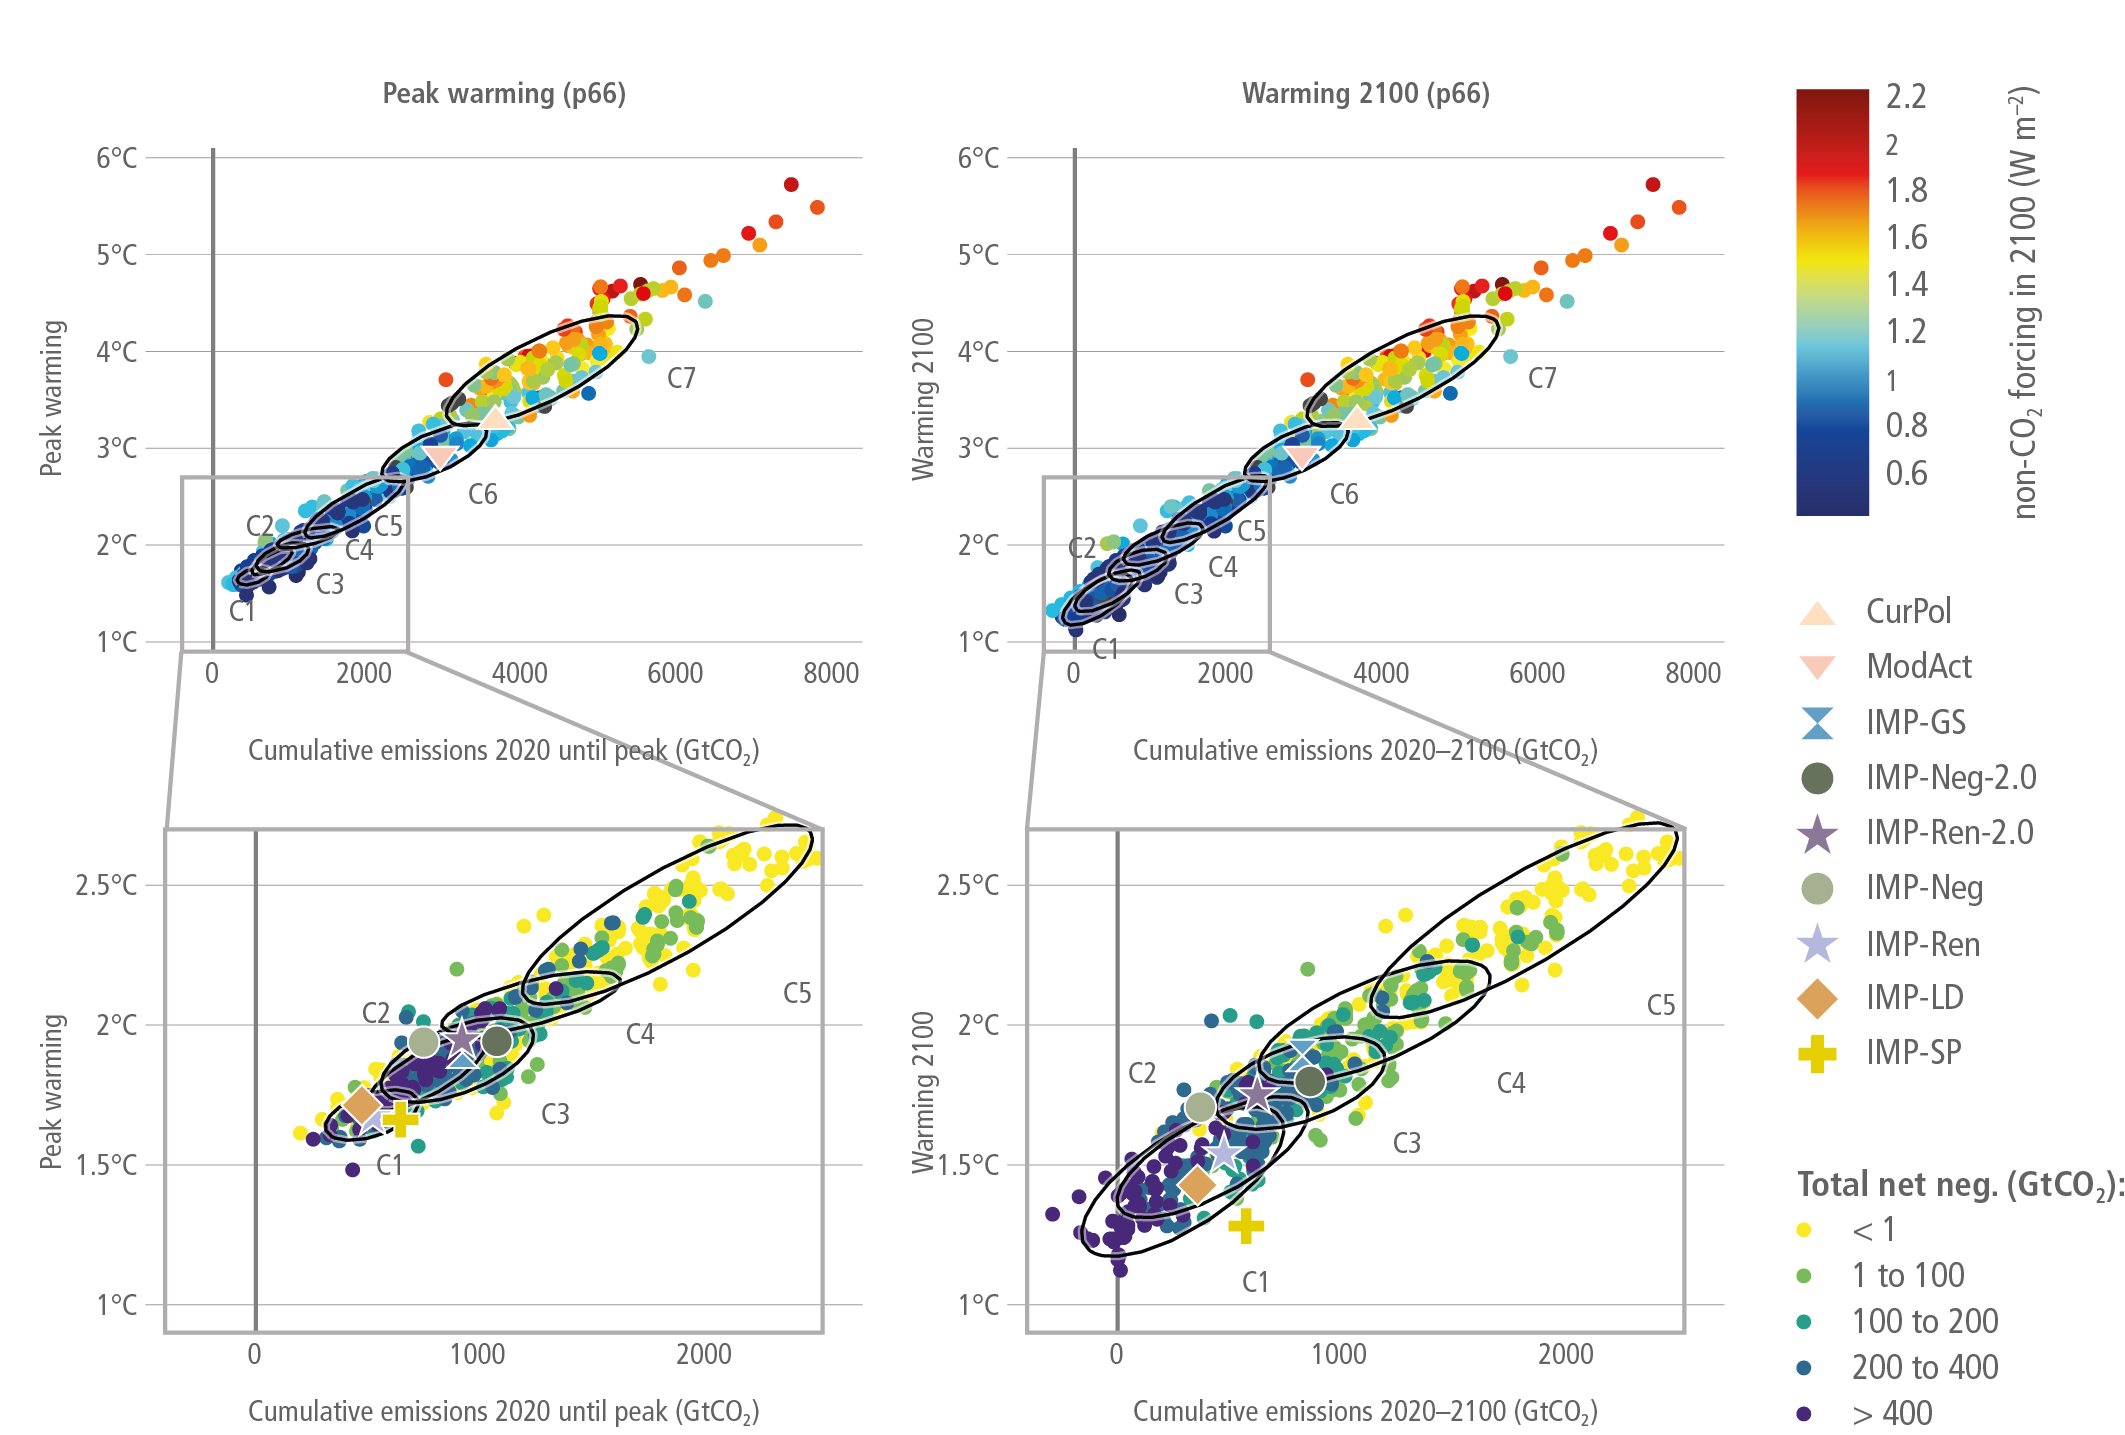
Figure caption
Figure 3.13 | The near-linear relationship between cumulative CO2 emissions and temperature. The left panel shows cumulative emissions until net zero emission is reached. The right panel shows cumulative emissions until the end of the century, plotted against peak and end-of-century temperature, respectively. Both are shown as a function of non-CO2 forcing and cumulative net negative CO2 emissions. Position temperature categories (circles) and IPs are also indicated, including two 2°C sensitivity cases for Neg (Neg-2.0) and Ren (Ren-2.0).