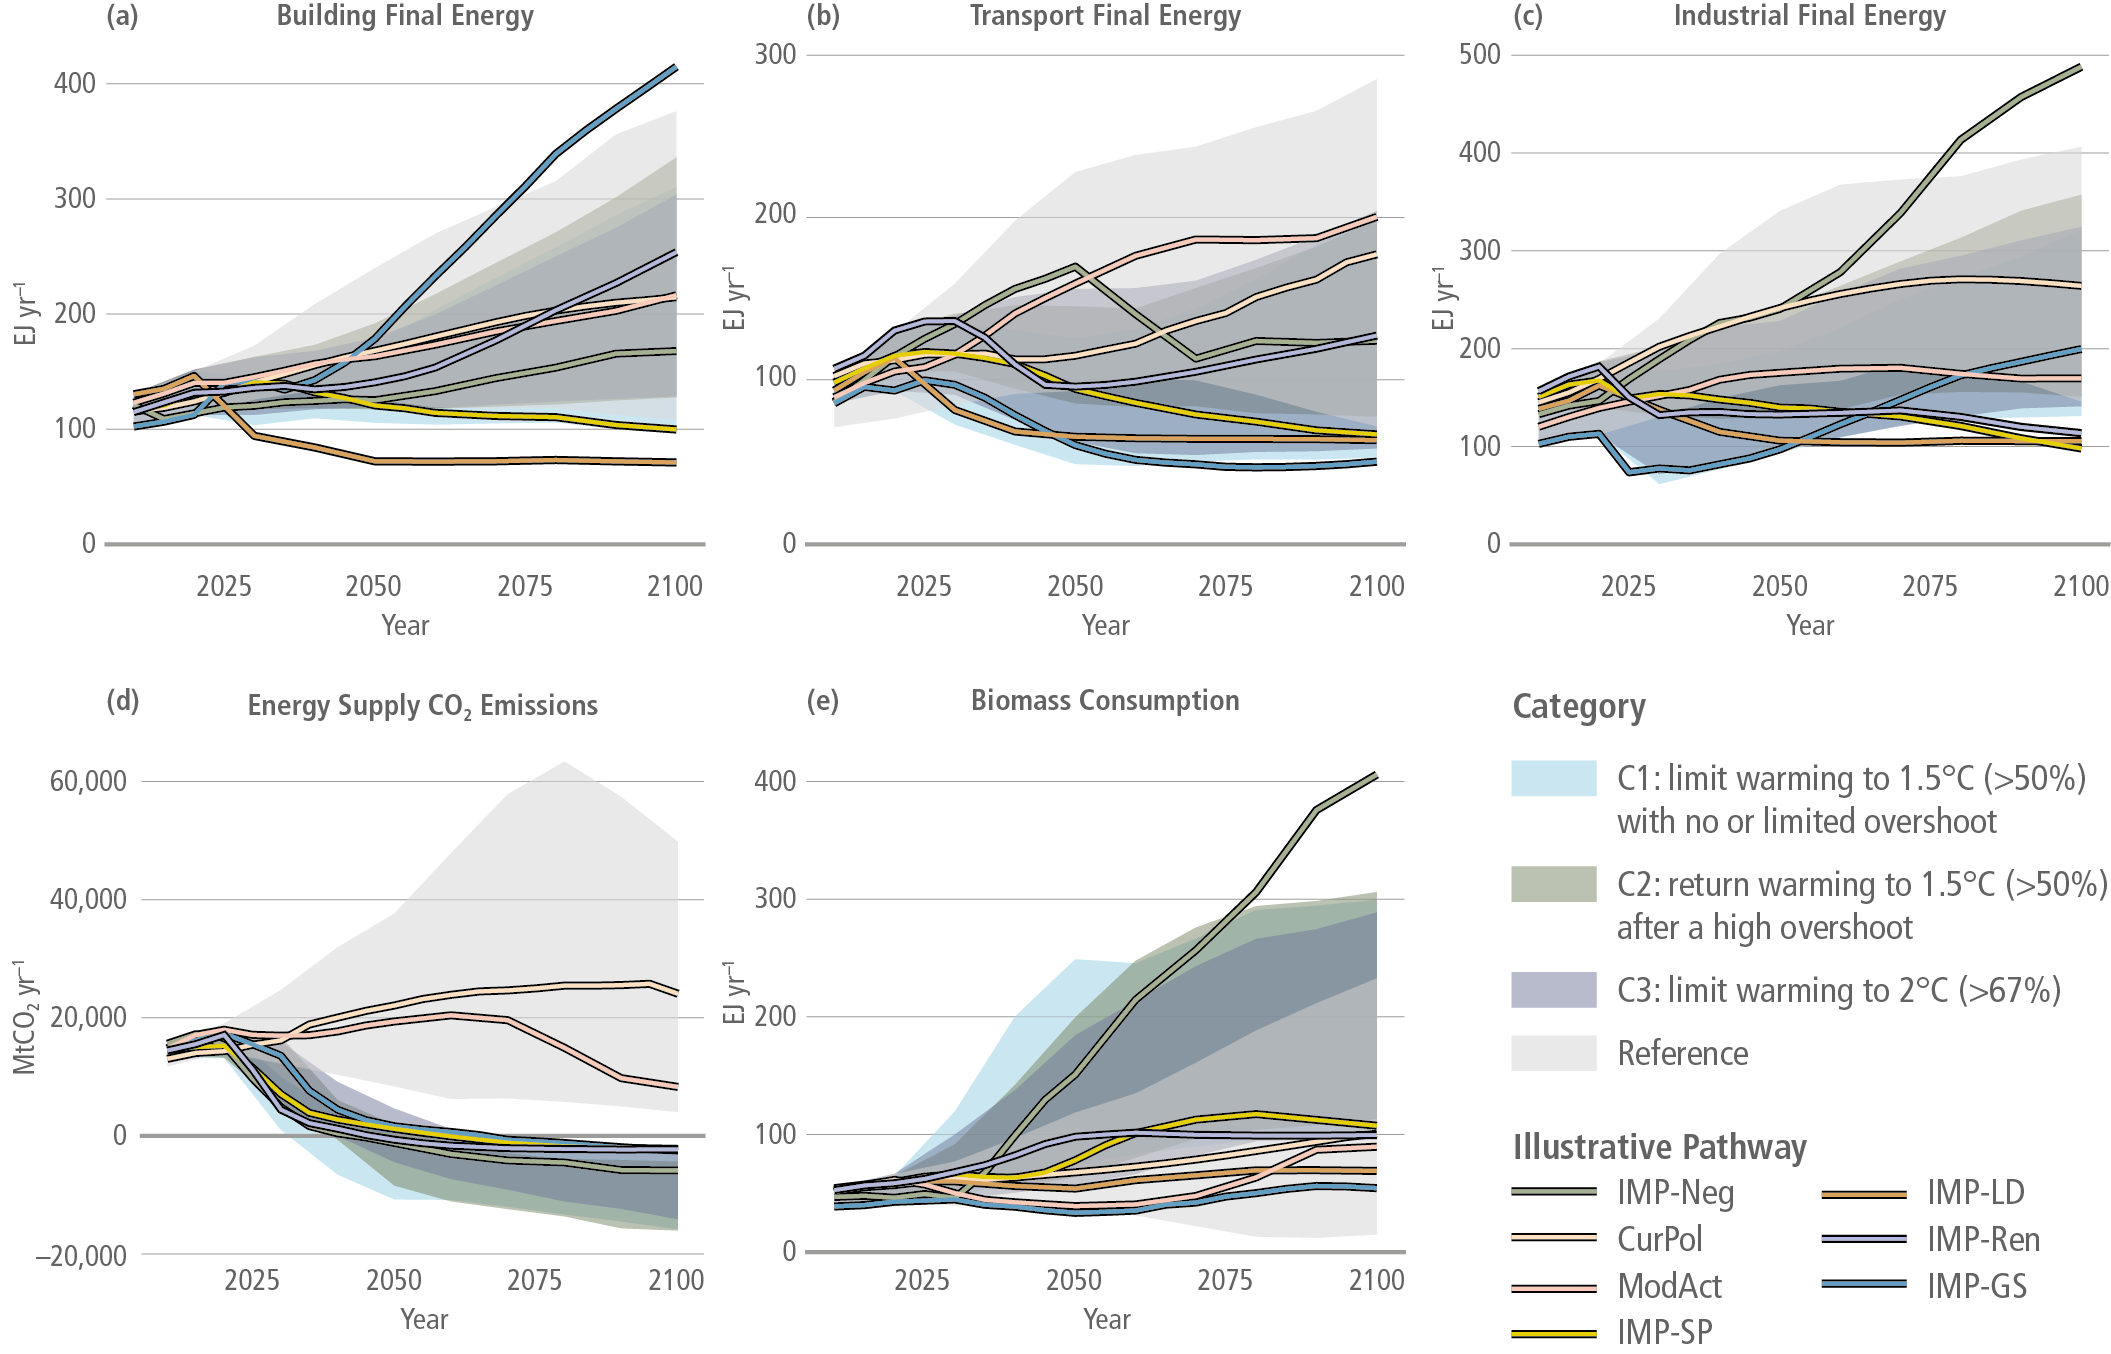
Figure 3.18 | Indicators of demand and supply-side mitigation in the Illustrative Pathways (lines) and the 5–95% range of Reference, 1.5°C and 2°C scenarios (shaded areas).