Back to chapter figures
Figure 3.19
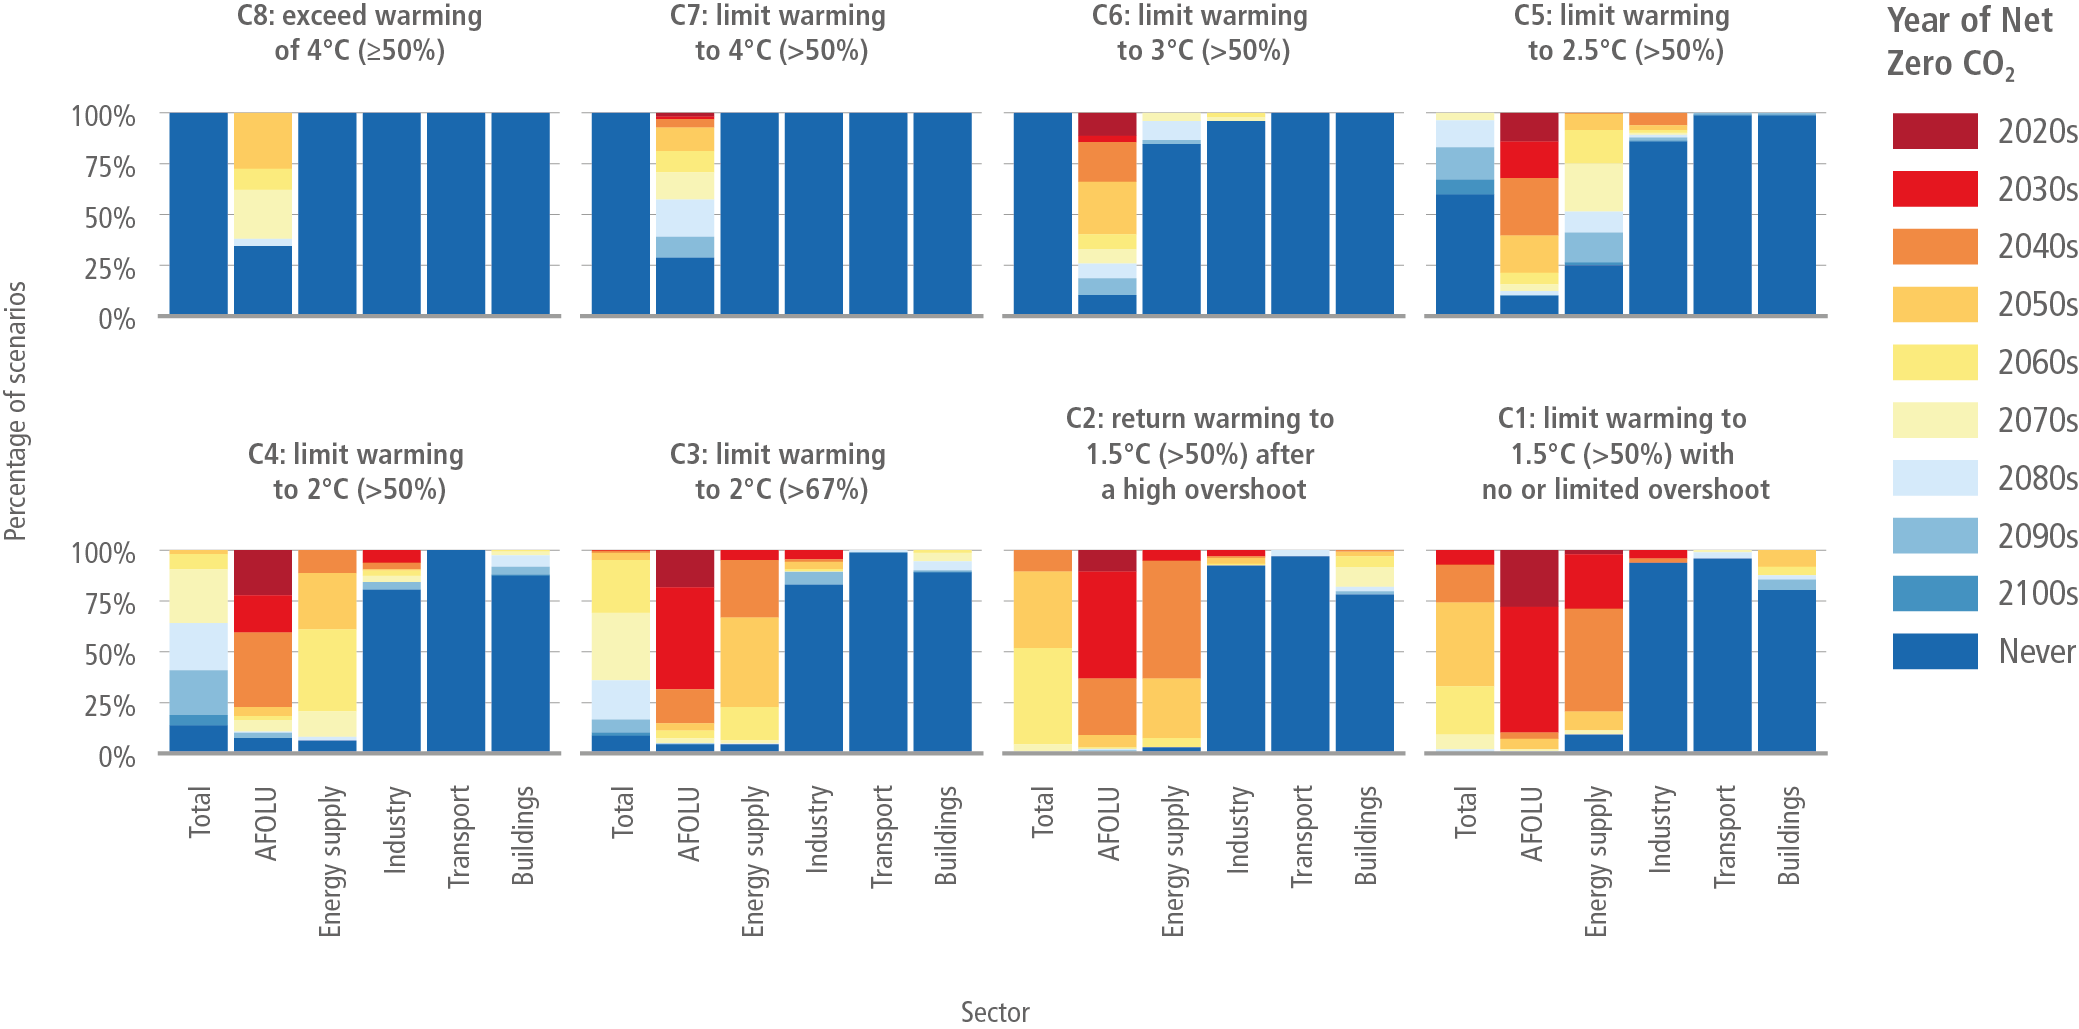
Figure caption
Figure 3.19 | Decade in which sectoral CO2 emissions first reach net negative values. Each panel is a different temperature level. The colours indicate the decade in which CO2 emissions go negative; the y-axis indicates the share of scenarios achieving net zero in that decade. Only scenarios that pass the vetting criteria are included (Section 3.2). Scenarios achieving net zero prior to 2020 are excluded.