Figure 3.20
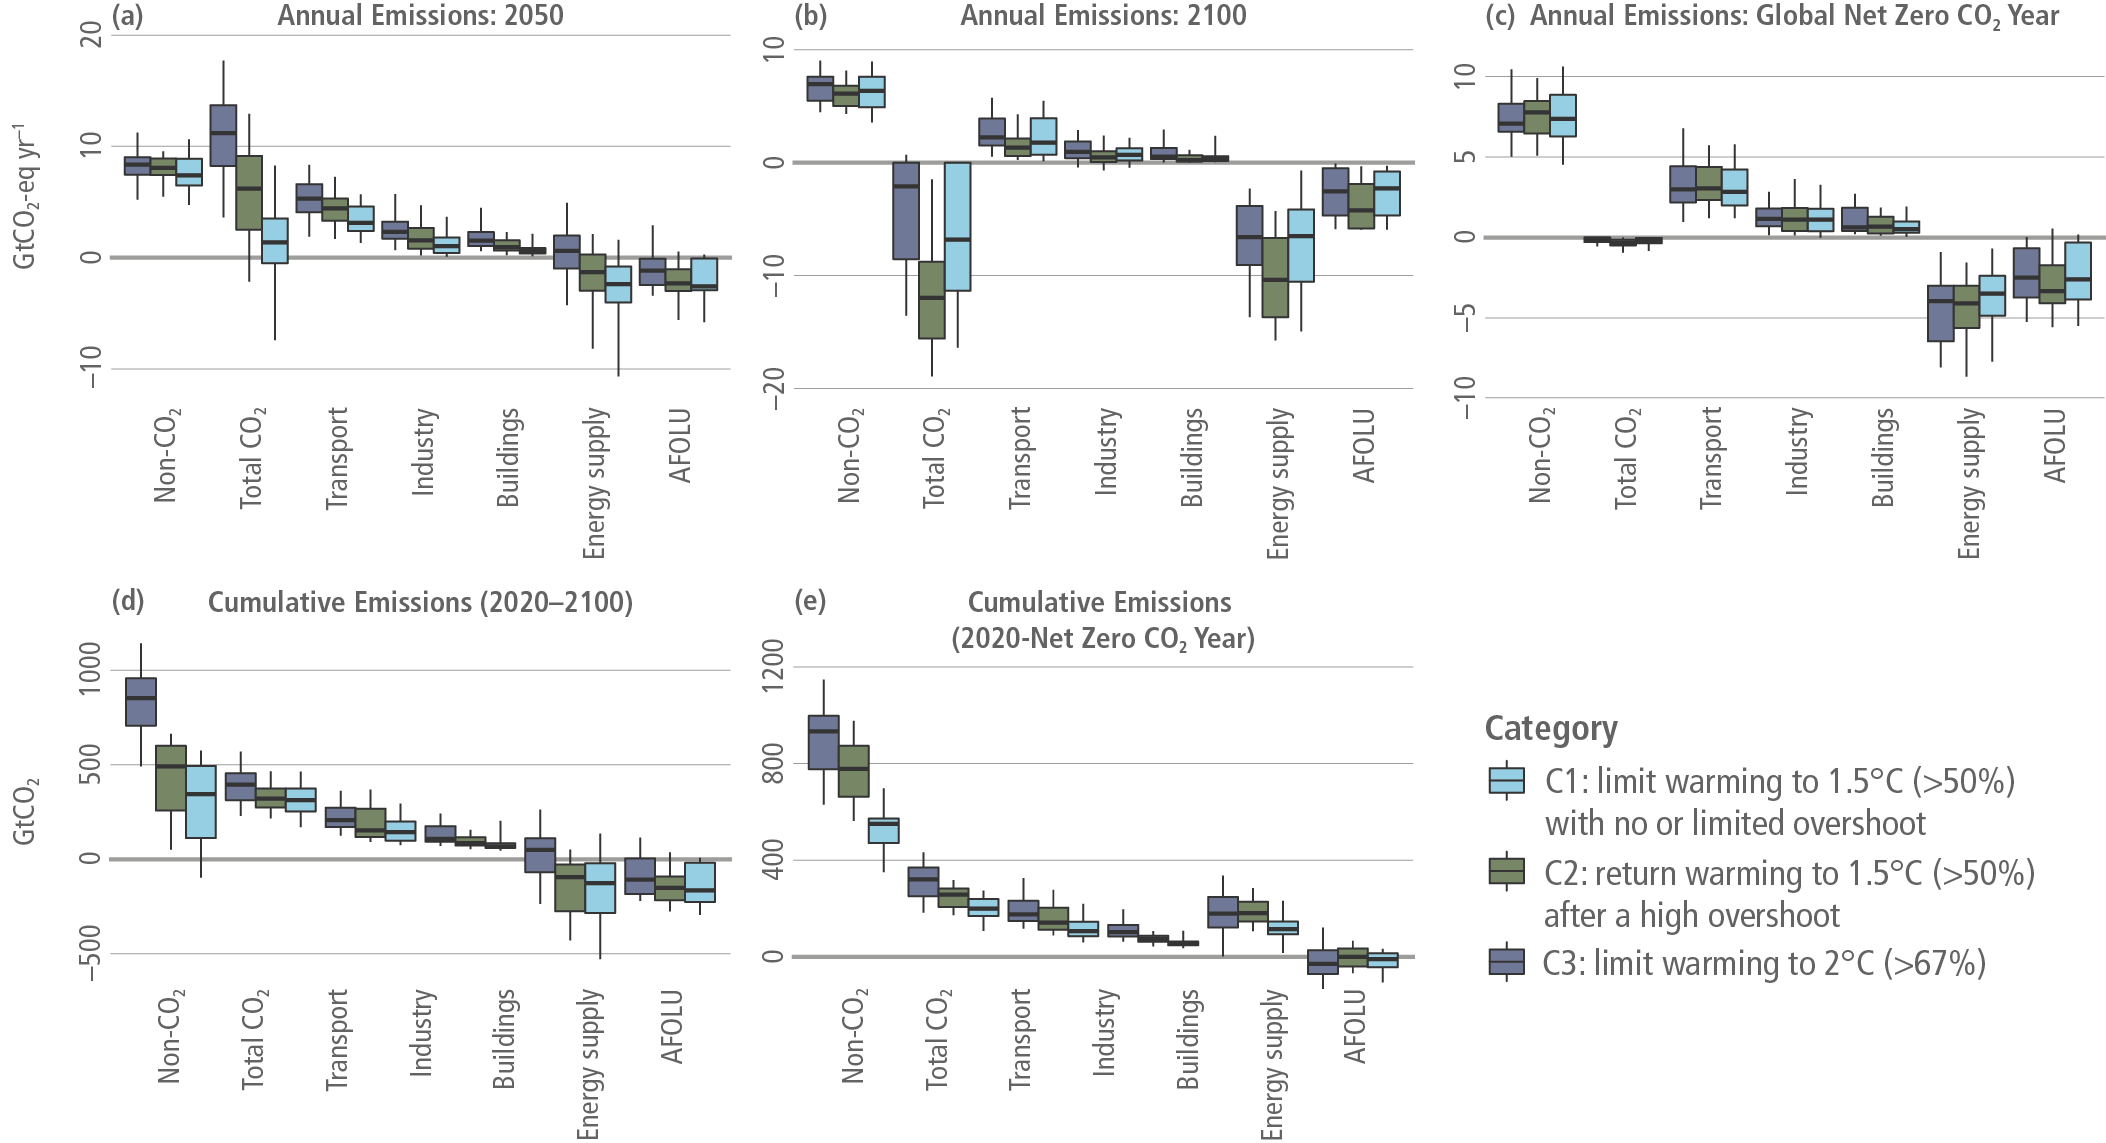
Figure caption
Figure 3.20 | Greenhouse gas (GHG) emissions, including CO2 emissions by sector and total non-CO2 GHGs in 2050 (top left), 2100 (top middle), year of global net zero CO2 (top right), cumulative CO2 emissions from 2020–2100 (bottom left), and cumulative CO2 emissions from 2020 until the year of net zero CO2 for scenarios that limit warming to below 2°C. Scenarios are grouped by their temperature category. ‘Industry’ includes CO2 emissions associated with industrial energy use only; sectors shown in this figure do not necessarily sum to total CO2. In this, and other figures in Section 3.4, unless stated otherwise, only scenarios that pass the vetting criteria are included (Section 3.2). Boxes indicate the interquartile range, the median is shown with a horizontal black line, while vertical lines show the 5–95% interval.