Figure 3.21
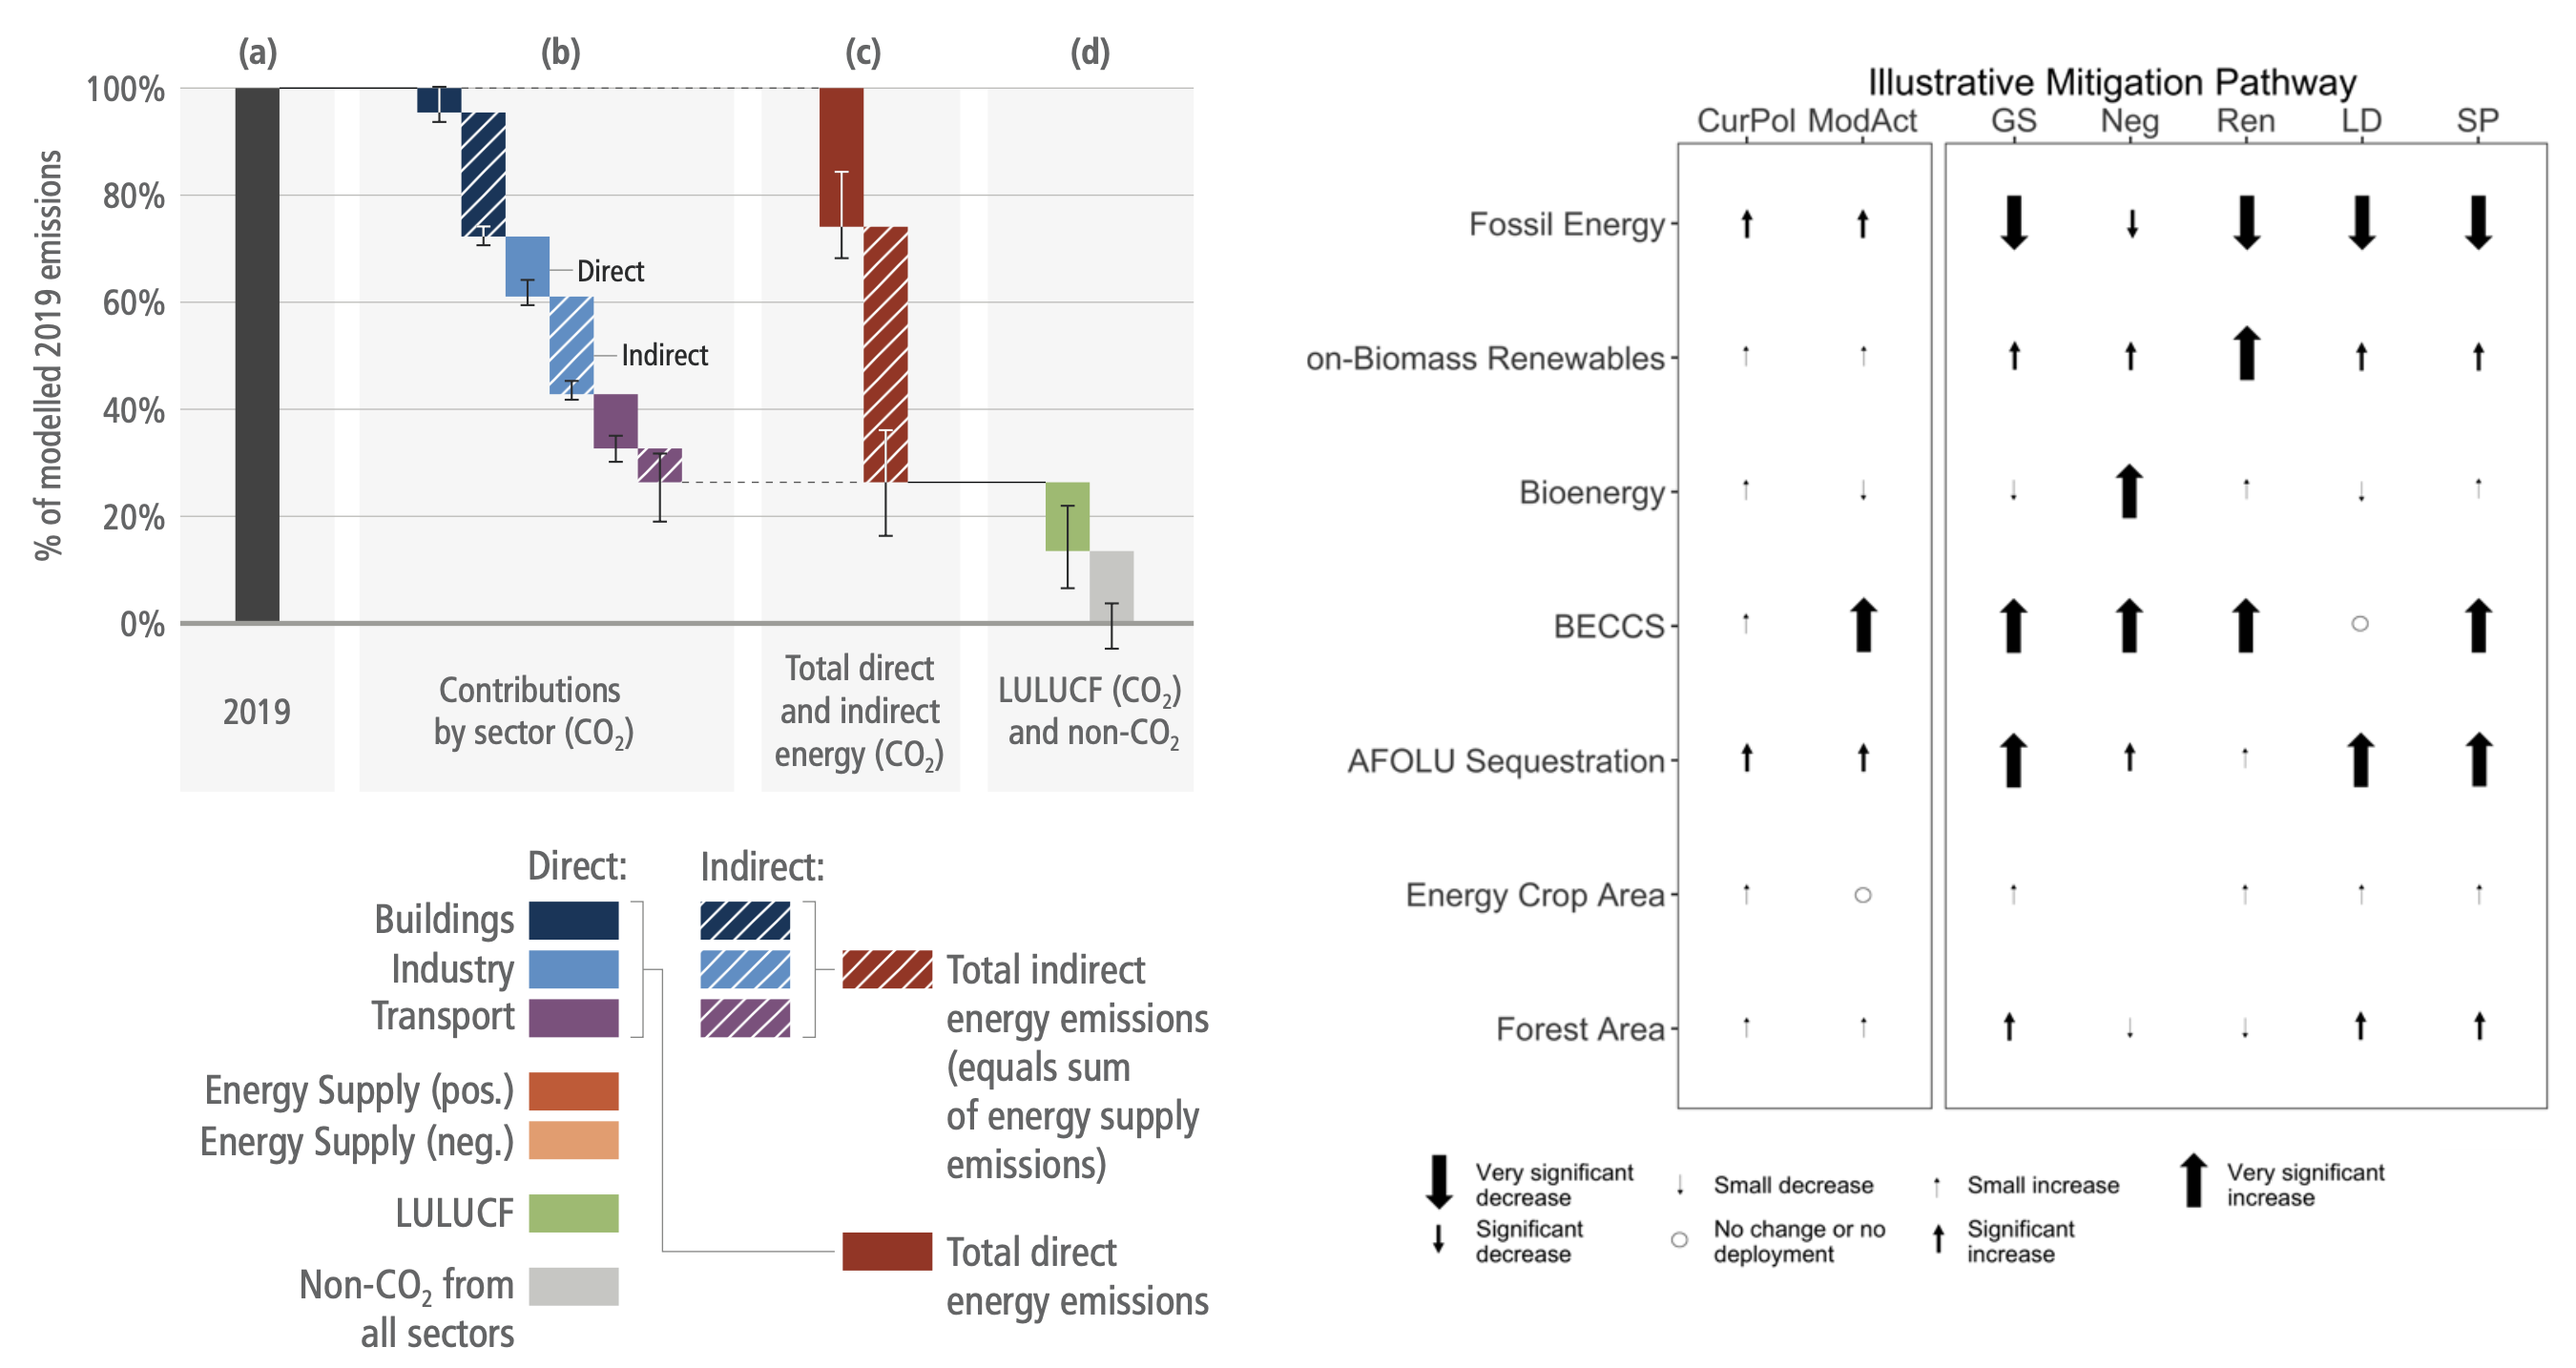
Figure caption
Figure 3.21 | Left panel: Greenhouse gas (GHG) emissions reductions from 2019 by sector at the year of net zero GHG for all scenarios that reach net zero GHG. Emissions reductions by sector for direct (demand) and indirect (upstream supply) are shown as the percent of total GHG reductions. Right panel: key indicators in 2050 for the IMPs. Definitions of significant and very significant are defined relative to 2019 and vary between indicators, as follows: fossil energy (significant >10%, very significant >50%), renewables (>150 EJ yr–1, >200 EJ yr–1), bioenergy (>100%, >200%), BECCS (>2.0 GtCO2 yr–1, >3.5 GtCO2 yr–1), AFOLU (>100% decline, >130% decline), energy crops (>150 million ha, >400 million ha), forest (>5% increase, >15% increase). Source: AR6 Scenarios Database.