Figure 3.29
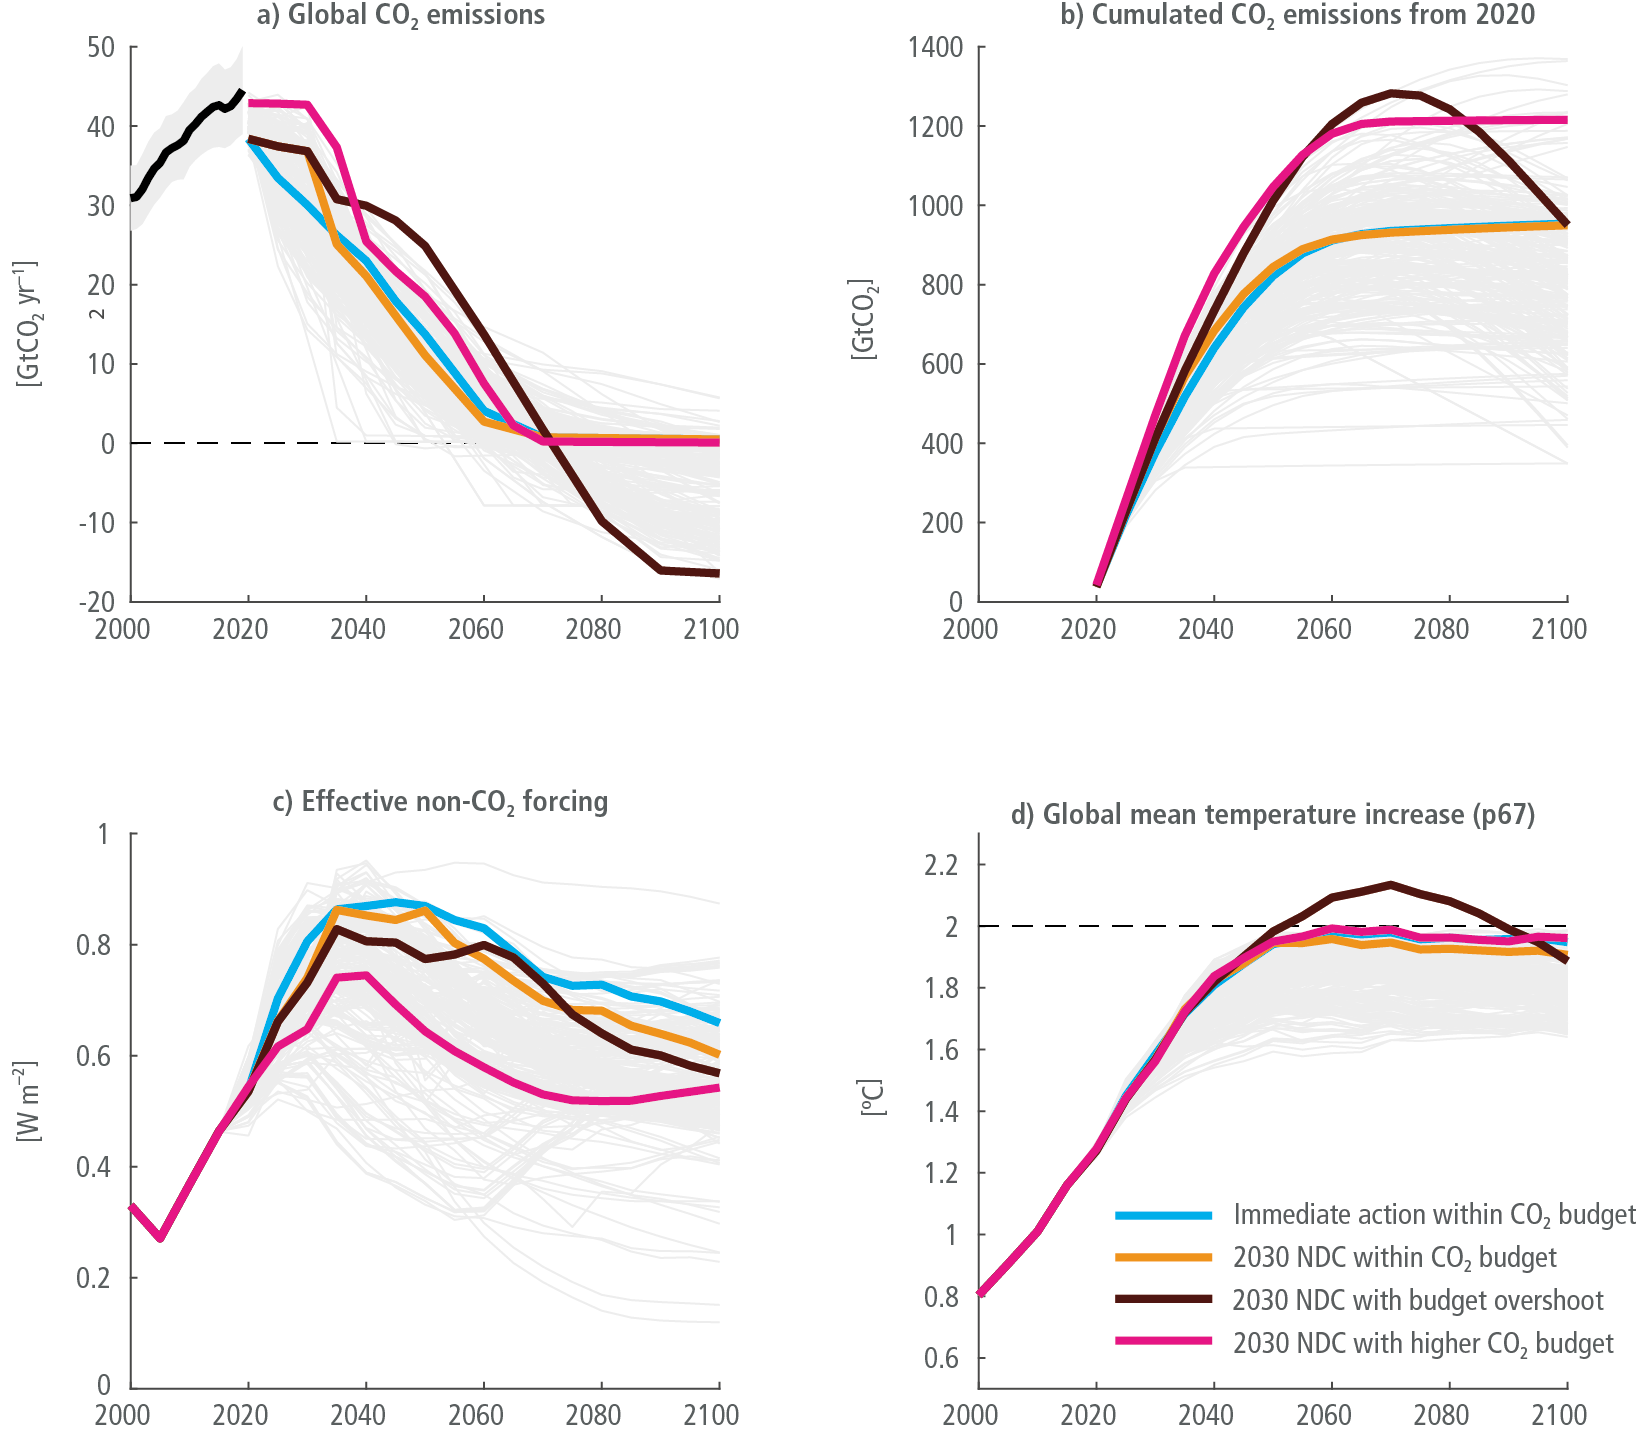
Figure caption
Figure 3.29 | Illustration of emissions and climate response in four mitigation pathways with different assumptions about near-term policy developments, global warming limit and non-CO2 warming contribution drawn from Riahi et al. (2021). Shown are (a) CO2 emissions trajectories, (b) cumulative CO2 emissions, (c) effective non-CO2 radiative forcing, and (d) the resulting estimate of the 67th percentile of global mean temperature response relative to 1850–1900. Light blue lines show a scenario that acts immediately on a remaining carbon budget of 900 GtCO2 from 2020 without allowing net negative CO2 emissions (i.e., temporary budget overshoot) (COFFEE 1.1, Scenario EN_NPi2020_900). Orange and black lines show scenarios drawn from the same model that follow the NDCs until 2030 and thereafter introduce action to stay within the same budget – in one case excluding net negative CO2 emissions like before (orange lines; COFFEE 1.1., Scenario EN-INDCi2030_900) and in the other allowing for a temporary overshoot of the carbon budget until 2100 (black lines; COFFEE 1.1., Scenario EN-INDCi2030_900f). Light blue lines describe a scenario following the NDCs until 2030, and then aiming for a higher budget of 2300 GtCO2 without overshoot (AIM/CGE 2.2, Scenario EN-INDCi2030_1200). It is drawn from another model which projects a lower anthropogenic non-CO2 forcing contribution and therefore achieves about the same temperature outcome as the other two non-overshoot scenarios despite the higher CO2 budget. Grey funnels include the trajectories from all scenarios that limit warming to 2°C (>67%) (category C3). Historical CO2 emissions until 2019 are from Chapter SM.2.1 EDGAR v6.0.