Figure 3.30
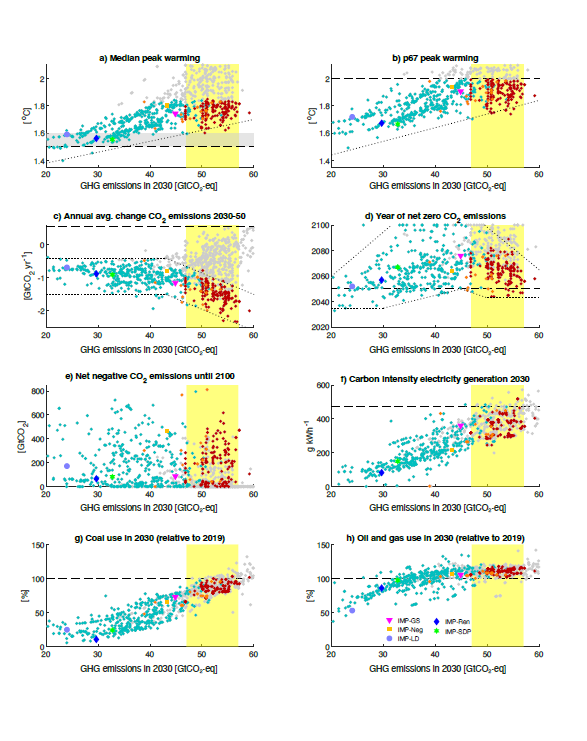
Figure caption
Figure 3.30 | Relationship between level of global GHG emissions in 2030 and selected indicators as listed in the panel titles for scenarios collected in the AR6 scenario database. Emissions data based on harmonised emissions used for the climate assessment. All scenarios that limit warming to 2°C (>67%) or lower are coloured blue or red (see p67 peak warming in panel (b)). The large majority of blue-coloured scenarios act immediately on the temperature target, while red-coloured scenarios depict all those that were designed to follow the NDCs or lesser action until 2030 and orange-coloured scenarios comprise a small set of pathways with additional regulatory action beyond NDCs (Section 3.5.3). Grey-coloured scenarios do not limit warming to 2°C (>67%) due to temporary overshoot or towards the end of the century. Large markers denote the five Illustrative Mitigation Pathways (IMPs) (legend in Panel (h); Section 3.2). Shaded yellow areas depict the estimated range of 2030 emissions from NDCs announced prior to COP26 (Section 4.2.2). Dotted lines are inserted in some panels to highlight trends in the dependency of selected output variables on 2030 GHG emissions levels (Section 3.5.2).