Figure 3.31
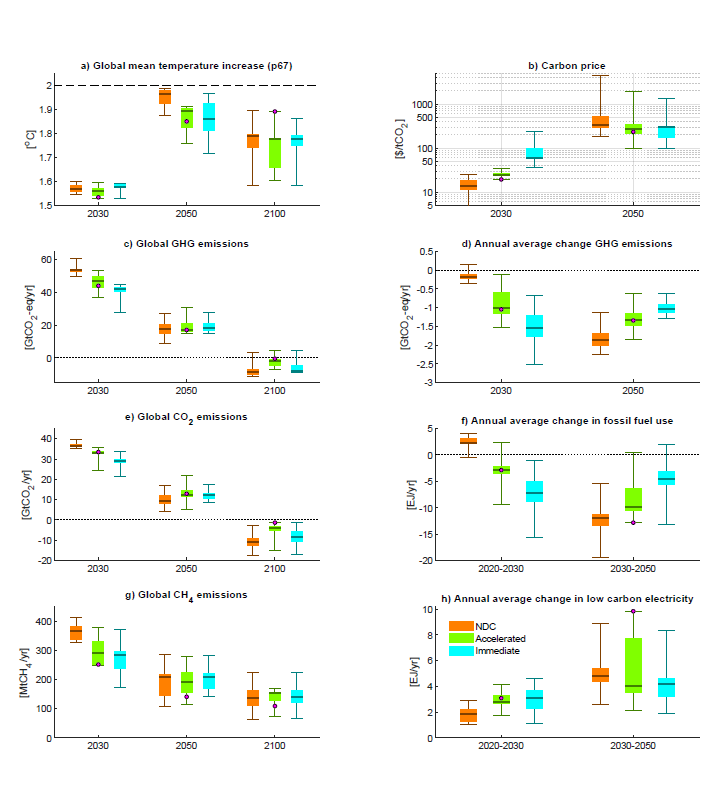
Figure caption
Figure 3.31 | Comparison of (i) pathways with immediate action to limit warming to 2°C (>67%) (Immediate, light blue), (ii) pathways following the NDCs until 2030 and limiting warming to 2°C (>67%) thereafter (NDC; orange), and (iii) pathways accelerating near-term action until 2030 beyond NDC ambition levels and limiting warming to 2°C (>67%) thereafter (accelerated) for selected indicators as listed in the panel titles, based on pathways from van Soest et al. (2021a). Low-carbon electricity comprises renewable and nuclear power. Indicator ranges are shown as box plots (full range, interquartile range, and median) for the years 2030, 2050 and 2100 (absolute values) and for the periods 2020–2030, 2030–2050 (change indicators). Ranges are based on nine models participating in van Soest et al. (2021a) with only seven models reporting emissions and climate results and eight models reporting carbon prices. The purple dot denotes the Illustrative Mitigation Pathway GS that was part of the study by van Soest et al.