Figure 3.34
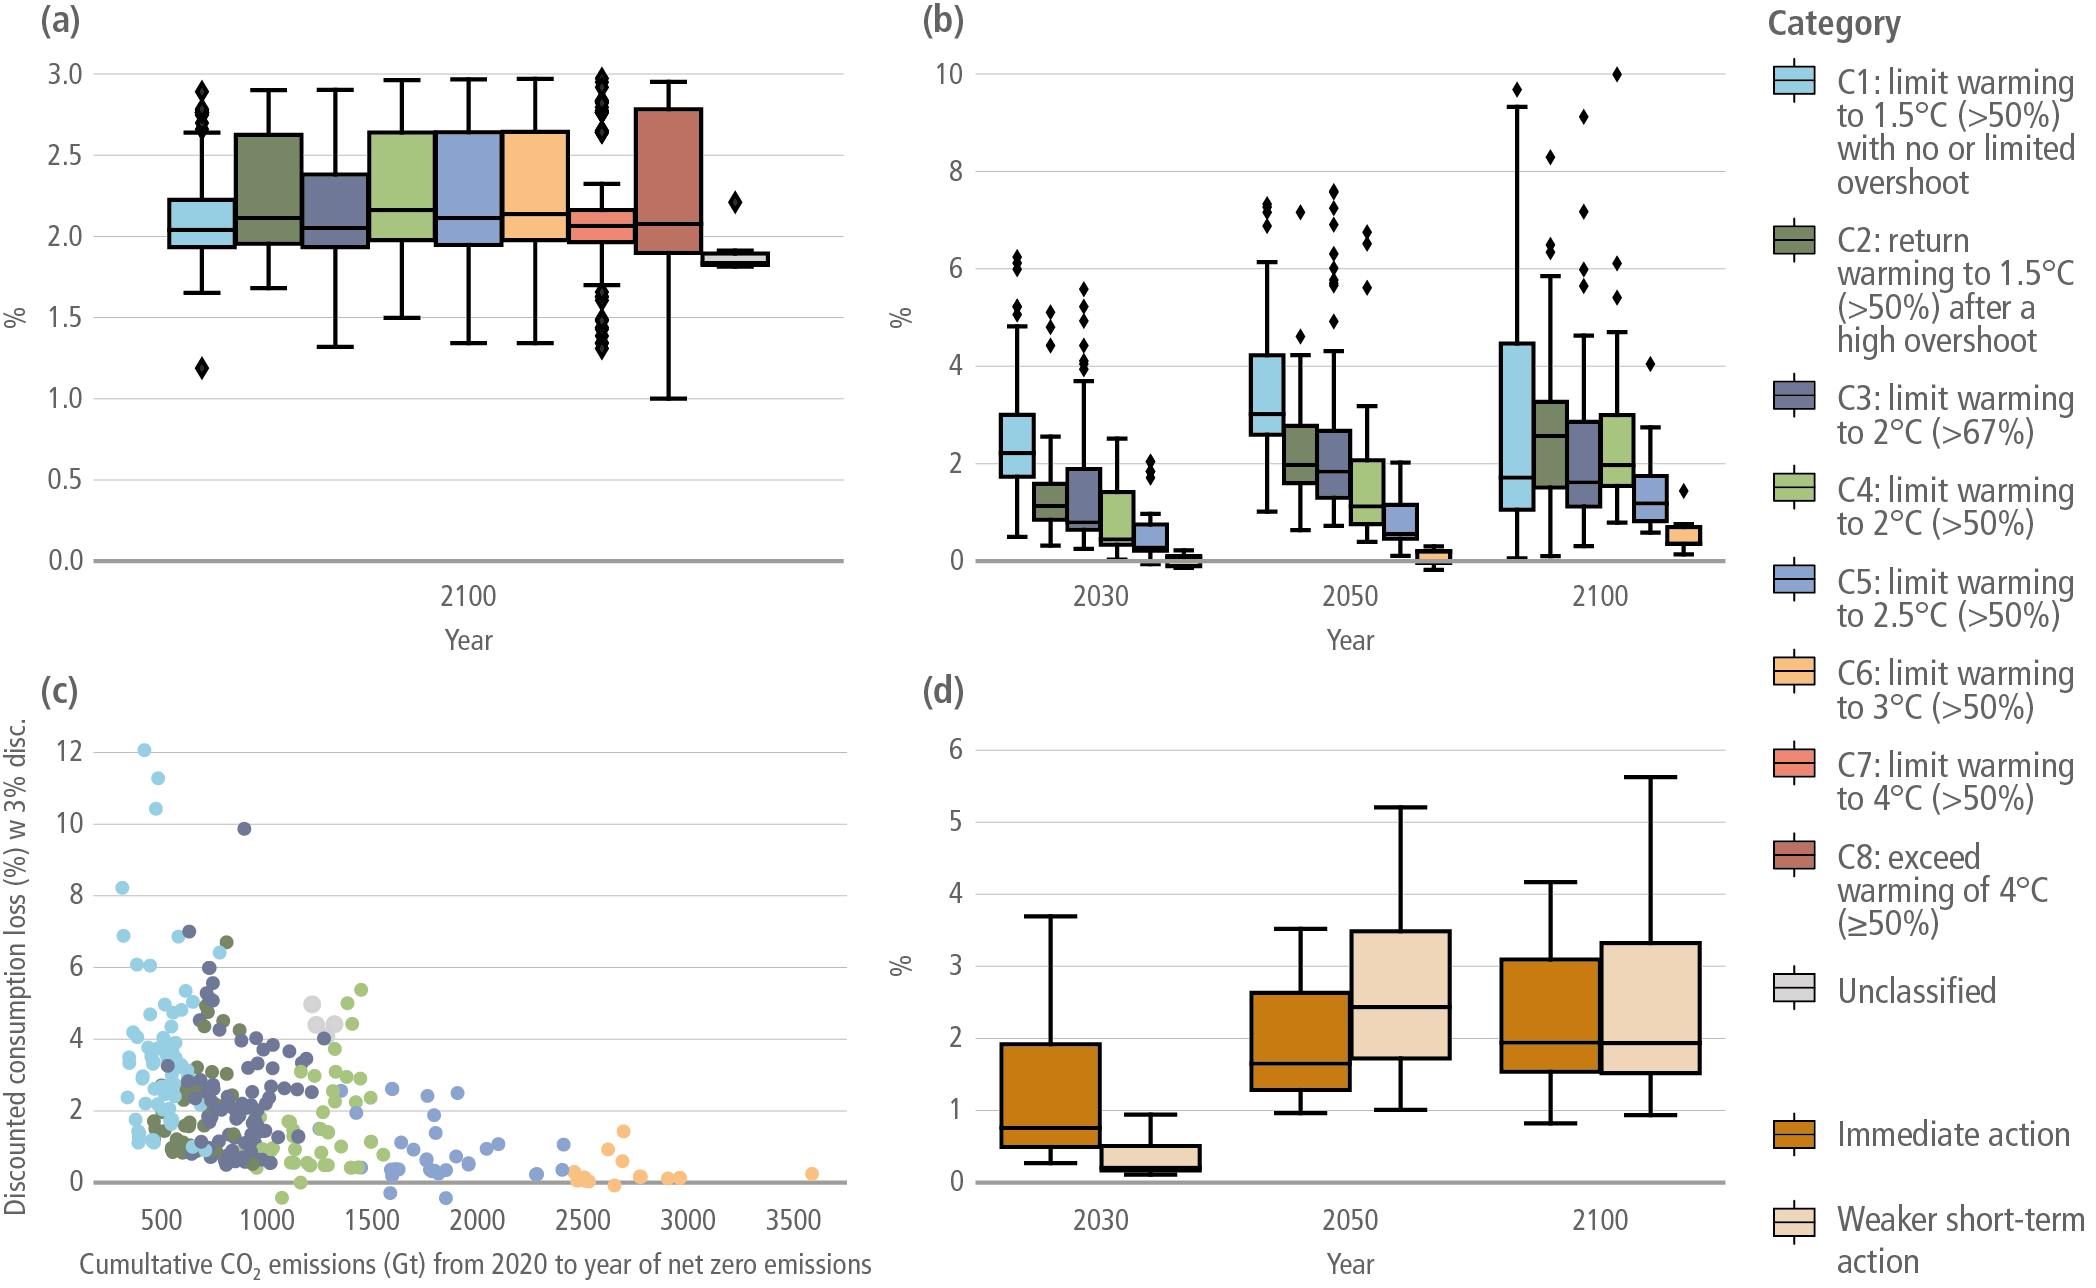
Figure caption
Figure 3.34 | (a) Mean annual global consumption growth rate over 2020–2100 for the mitigation pathways in the AR6 scenarios database. (b) Global GDP loss compared to baselines (not accounting for climate change damages) in 2030, 2050 and 2100 for mitigation pathways with immediate global action. (c) Total discounted consumption loss (with a 3% discount rate) in mitigation scenarios with respect to their corresponding baseline (not accounting for climate change damages) as a function of cumulative CO2 emissions until date of net zero CO2. (d) Comparison of GDP losses compared to baselines (not accounting for climate change damages) in 2030, 2050 and 2100 for pairs of scenarios depicting immediate action pathways and delayed action pathways. Source: AR6 Scenarios Database.