Figure 3.38
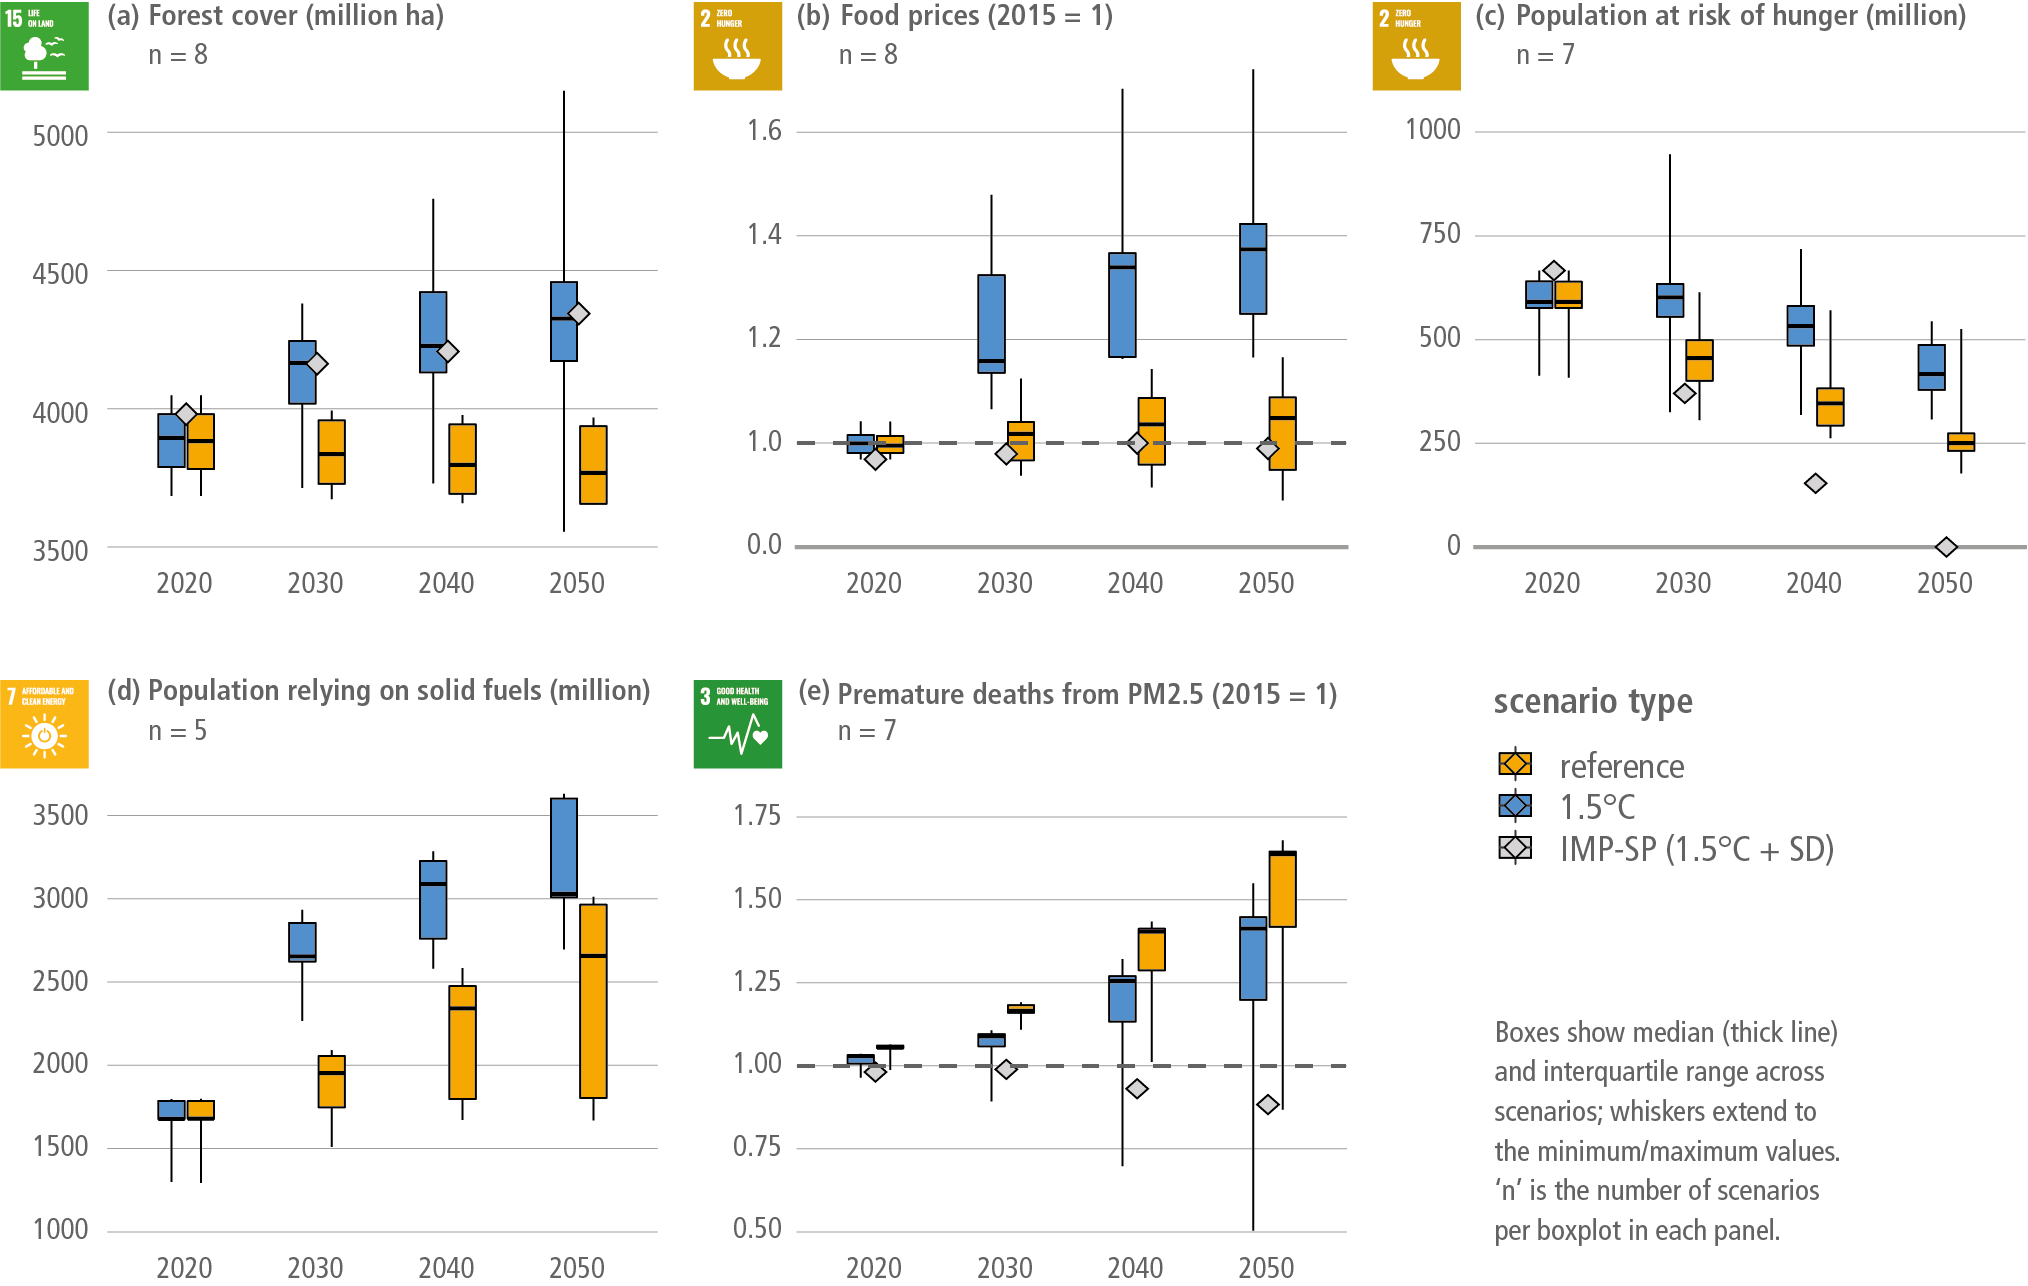
Figure caption
Figure 3.38 | Effect of climate change mitigation on different dimensions of sustainable development: shown are mitigation scenarios compatible with the 1.5°C target (blue) and reference scenarios (yellow). Blue box plots contain scenarios that include narrow mitigation policies from different studies (see below). This is compared to a sustainable development scenario (SP, Soergel et al. (2021a), grey diamonds) integrating mitigation and SD policies (e.g., zero hunger in 2050 by assumption). Scenario sources for box plots: single scenarios from: (i) Fujimori et al. (2020a); (ii) Soergel et al. (2021a); multi-model scenario set from CD-LINKS (McCollum et al. 2018b; Fujimori et al. 2019; Roelfsema et al. 2020). For associated methods, see also Cameron et al. (2016) and Rafaj et al. (2021). The reference scenario for Fujimori et al. (2020a) is no-policy baseline; for all other studies, it includes current climate policies. In the ‘Food prices’ and ‘Risk of hunger’ panels, scenarios from CD-LINKS include a price cap of USD200 tCO2-eq for land-use emissions (Fujimori et al. 2019). For the other indicators, CD-LINKS scenarios without price cap (Roelfsema et al. 2020) are used due to SDG indicator availability. In the ‘Premature deaths’ panel, a well-below 2°C scenario from Fujimori et al. (2020a) is used in place of a 1.5°C scenario due to data availability, and all scenarios are indexed to their 2015 values due to a spread in reported levels between models. SDG icons were created by the United Nations.