Figure 3.39
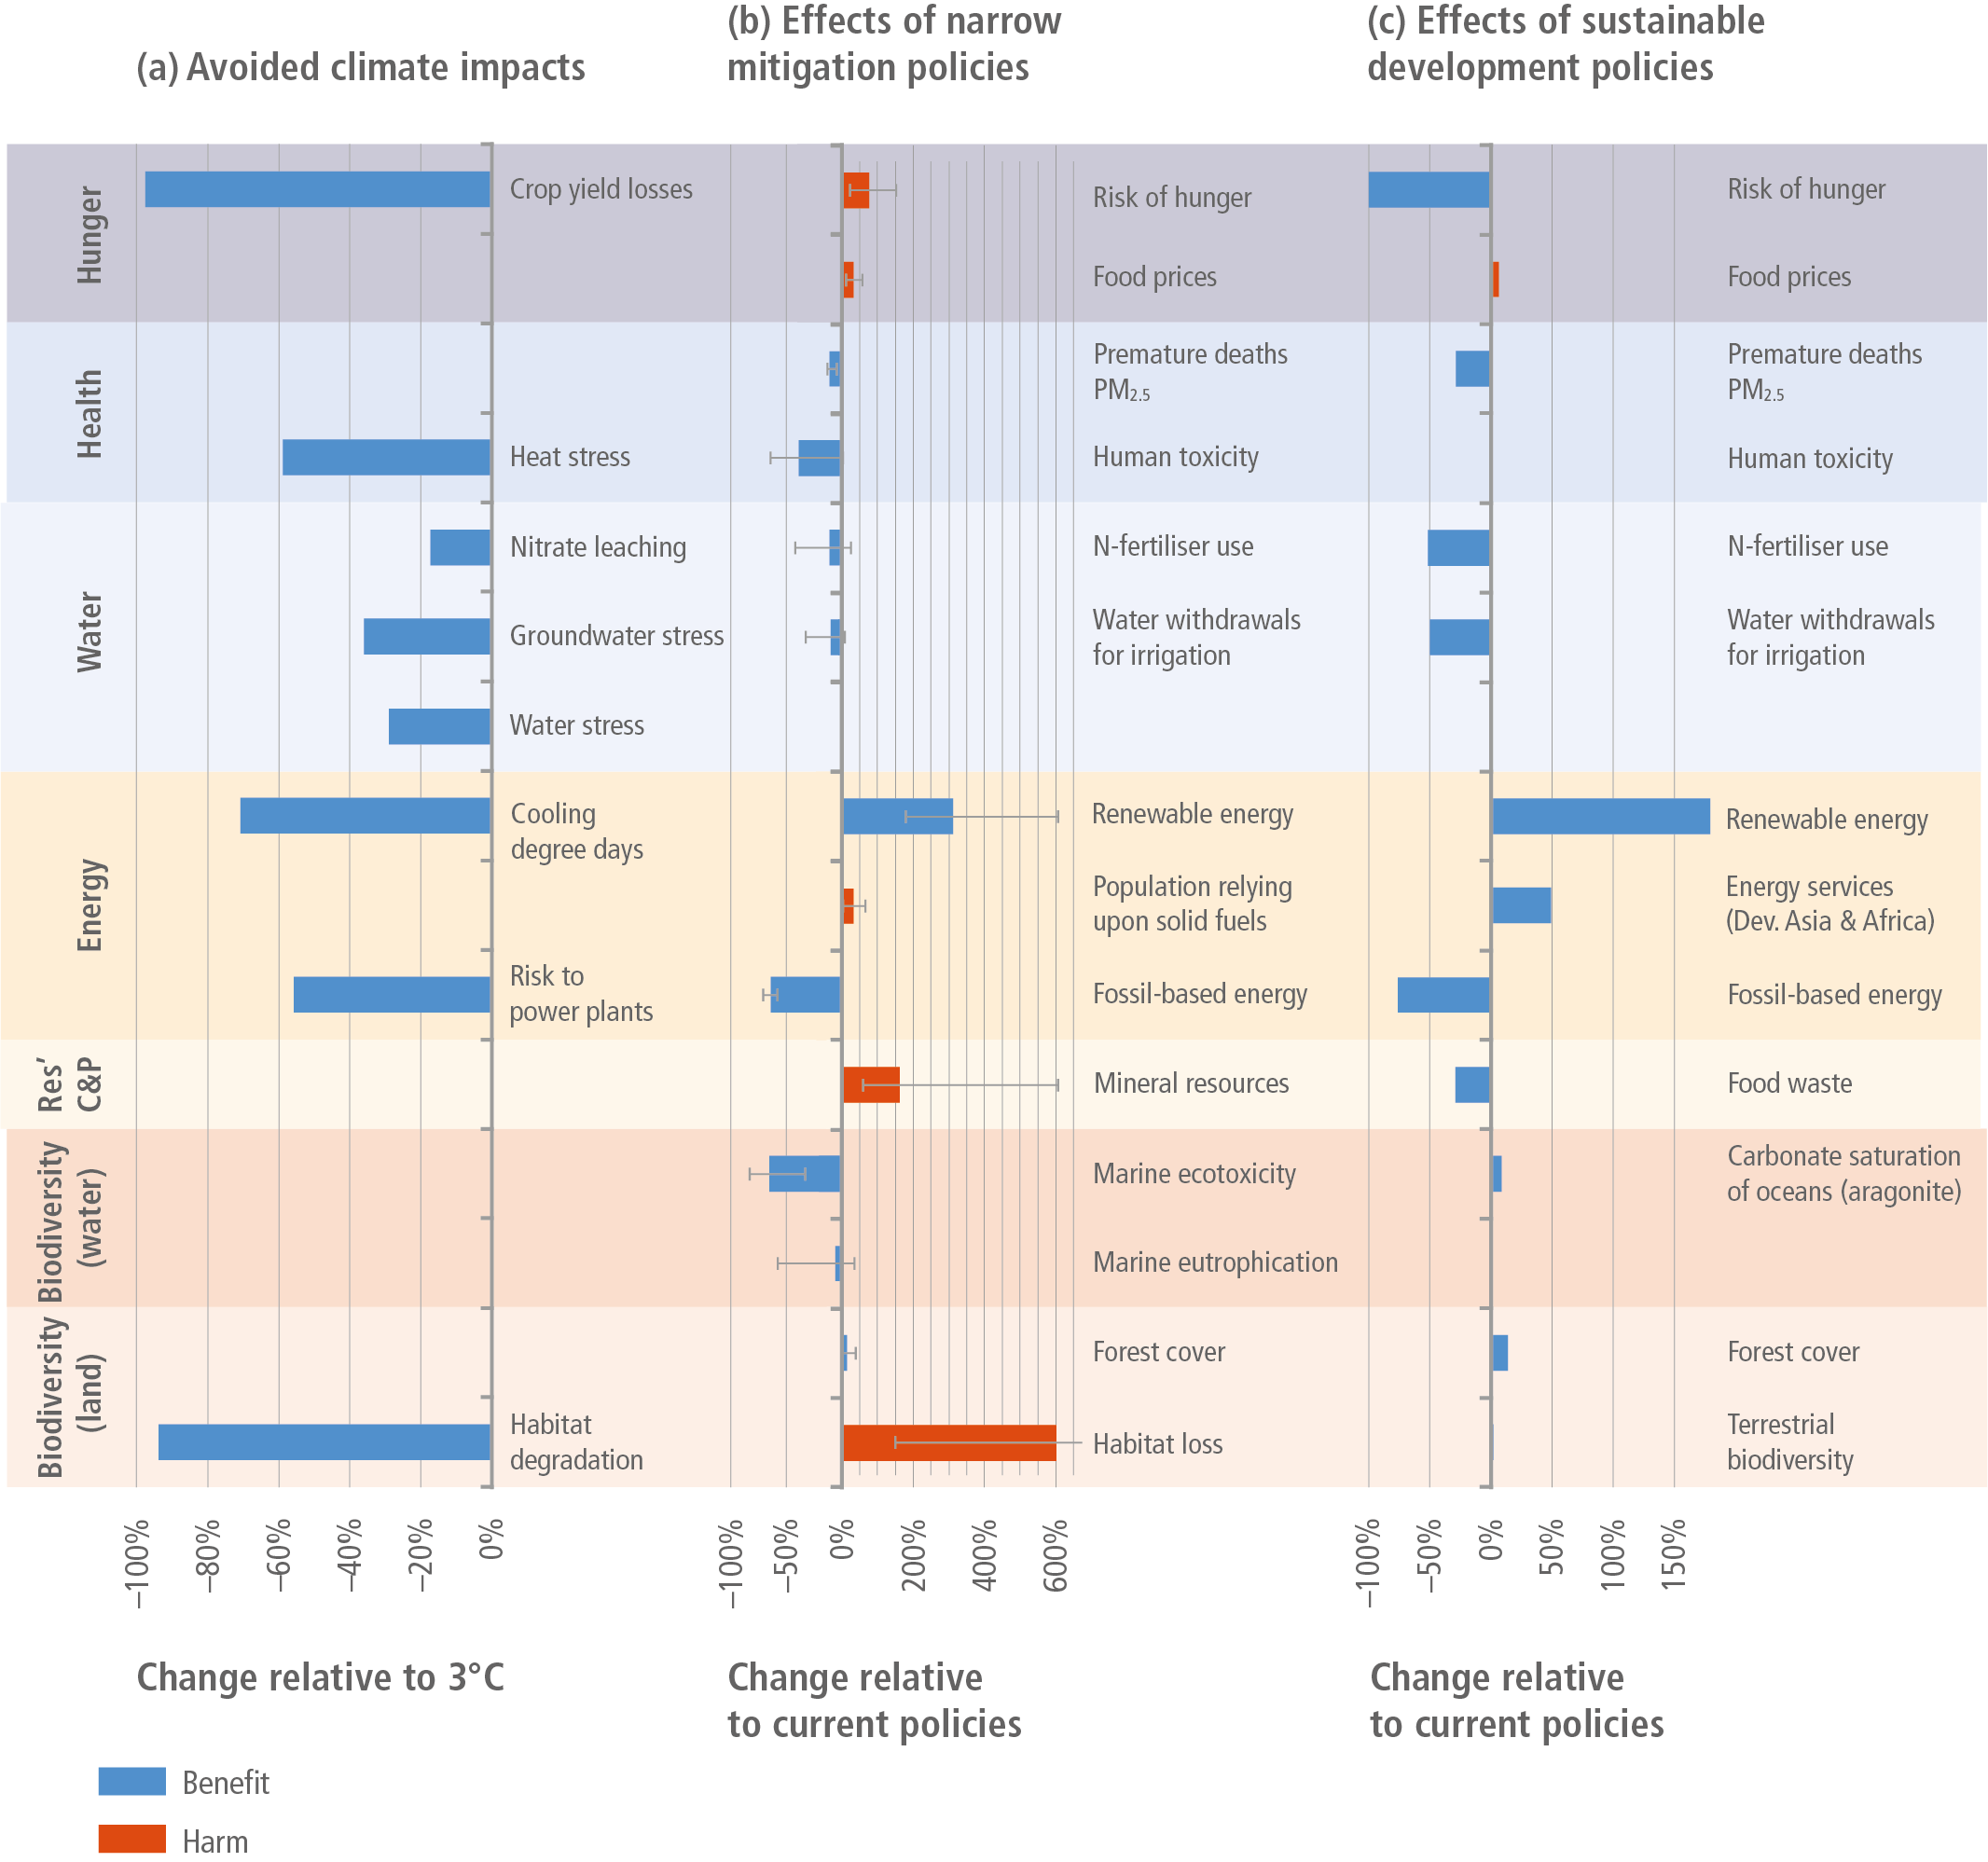
Figure caption
Figure 3.39 | Sustainable development effects of mitigation to 1.5°C. Panel (a): benefits of mitigation from avoided impacts. Panel (b): sustainability co-benefits and trade-offs of narrow mitigation policies (averaged over multiple models). Panel (c): sustainability co-benefits and trade-offs of mitigation policies integrating Sustainable Development Goals. Scale: 0% means no change compared to 3°C (left) or current policies (middle and right). Blue values correspond to proportional improvements, red values to proportional worsening. Note: only the left panel considers climate impacts on sustainable development; the middle and right panels do not. ‘Res’ C&P’ stands for Responsible Consumption and Production (SDG 12). Data are from Byers et al. (2018) (left), SP/Soergel et al. (2021a) (right). Methods used in middle panel: for biodiversity, Ohashi et al. (2019); for ecotoxicity and eutrophication, Arvesen et al. (2018) and Pehl et al. (2017); for energy access, Cameron et al. (2016). ‘Energy services’ on the right is a measure of useful energy in buildings and transport. ‘Food prices’ and ‘Risk of hunger’ in the middle panel are the same as in Figure 3.38.