Back to chapter figures
Figure 4.5
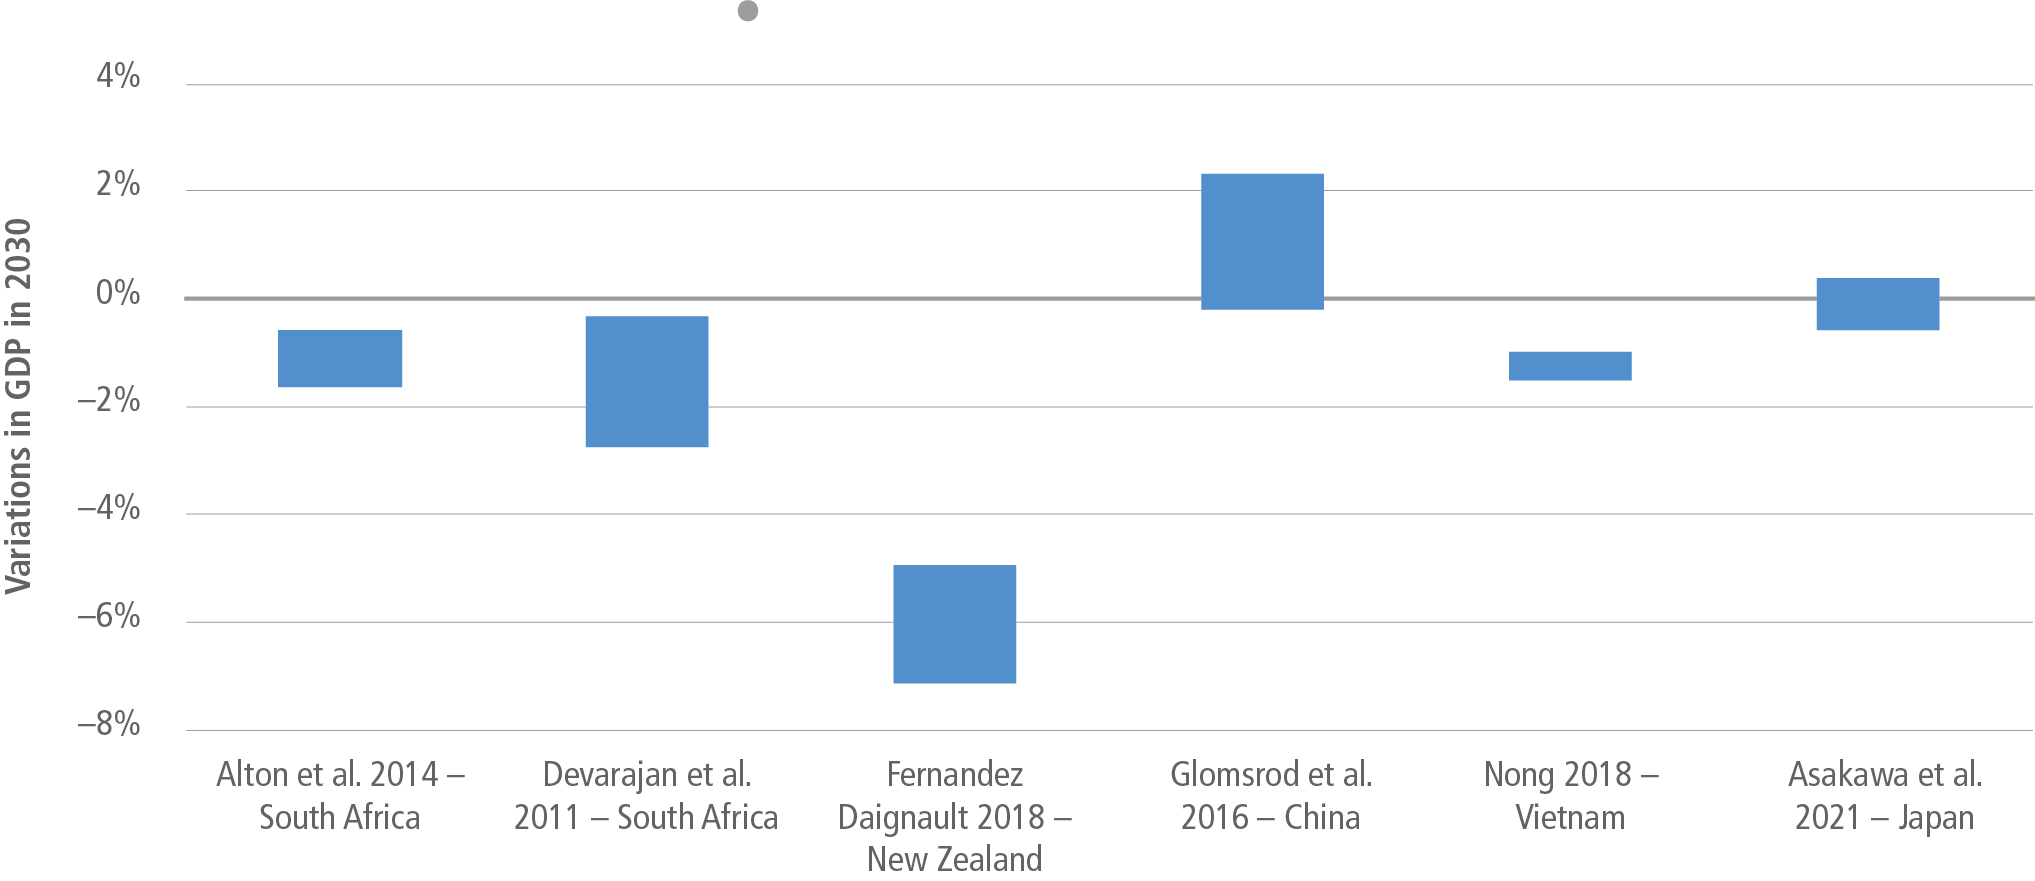
Figure caption
Figure 4.5 | Illustrative ranges of variations in GDP relative to reference in 2030 associated with introduction of carbon constraint, depending on modality of policy implementation. Source: based on Alton et al. (2014); Devarajan et al. (2011); Fernandez and Daigneault (2018); Glomsrød et al. (2016); Nong (2018); Asakawa et al. (2021). Stringency of carbon constraint is not comparable across the studies.