Figure 5.10
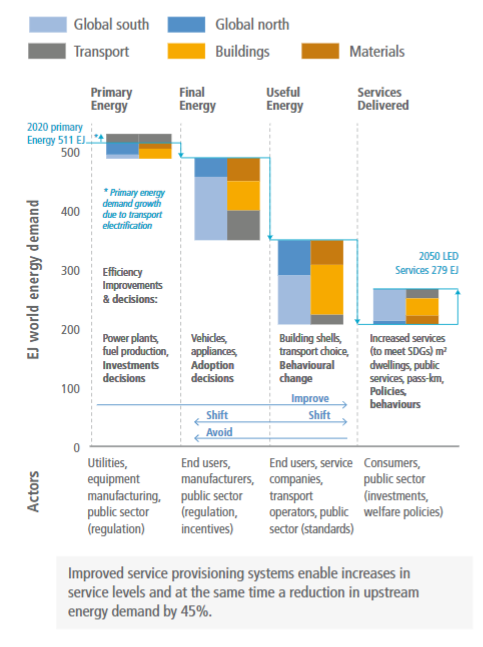
Figure caption
Figure 5.10 | Realisable energy efficiency improvements by region and by end-use type between 2020 and 2050 in an illustrative Low Energy Demand scenario (in EJ). Efficiency improvements are decomposed by respective steps in the conversion chain from primary energy to final, and useful, energy, and to service delivery, and disaggregated by region (developed and developing countries) and end-use type (buildings, transport, materials). Improvements are dominated by improved efficiency in service delivery (153 EJ) and by more efficient end-use energy conversion (134 EJ). Improvements in service efficiency in transport shown here are conservative in this scenario but could be substantially higher with the full adoption of integrated urban shared mobility schemes. Increases in energy use due to increases in service levels and system effects of transport electrification (grey bars on top of first pair in the bar charts) that counterbalance some of the efficiency improvements are also shown. Examples of options for efficiency improvements and decision involved (grey text in the chart), the relative weight of generic demand-side strategies (Avoid-Shift-Improve blue arrows), as well as prototype actors involved, are also illustrated. Data source: Figure 5.9 and Grubler et al. (2018).