Figure 5.2
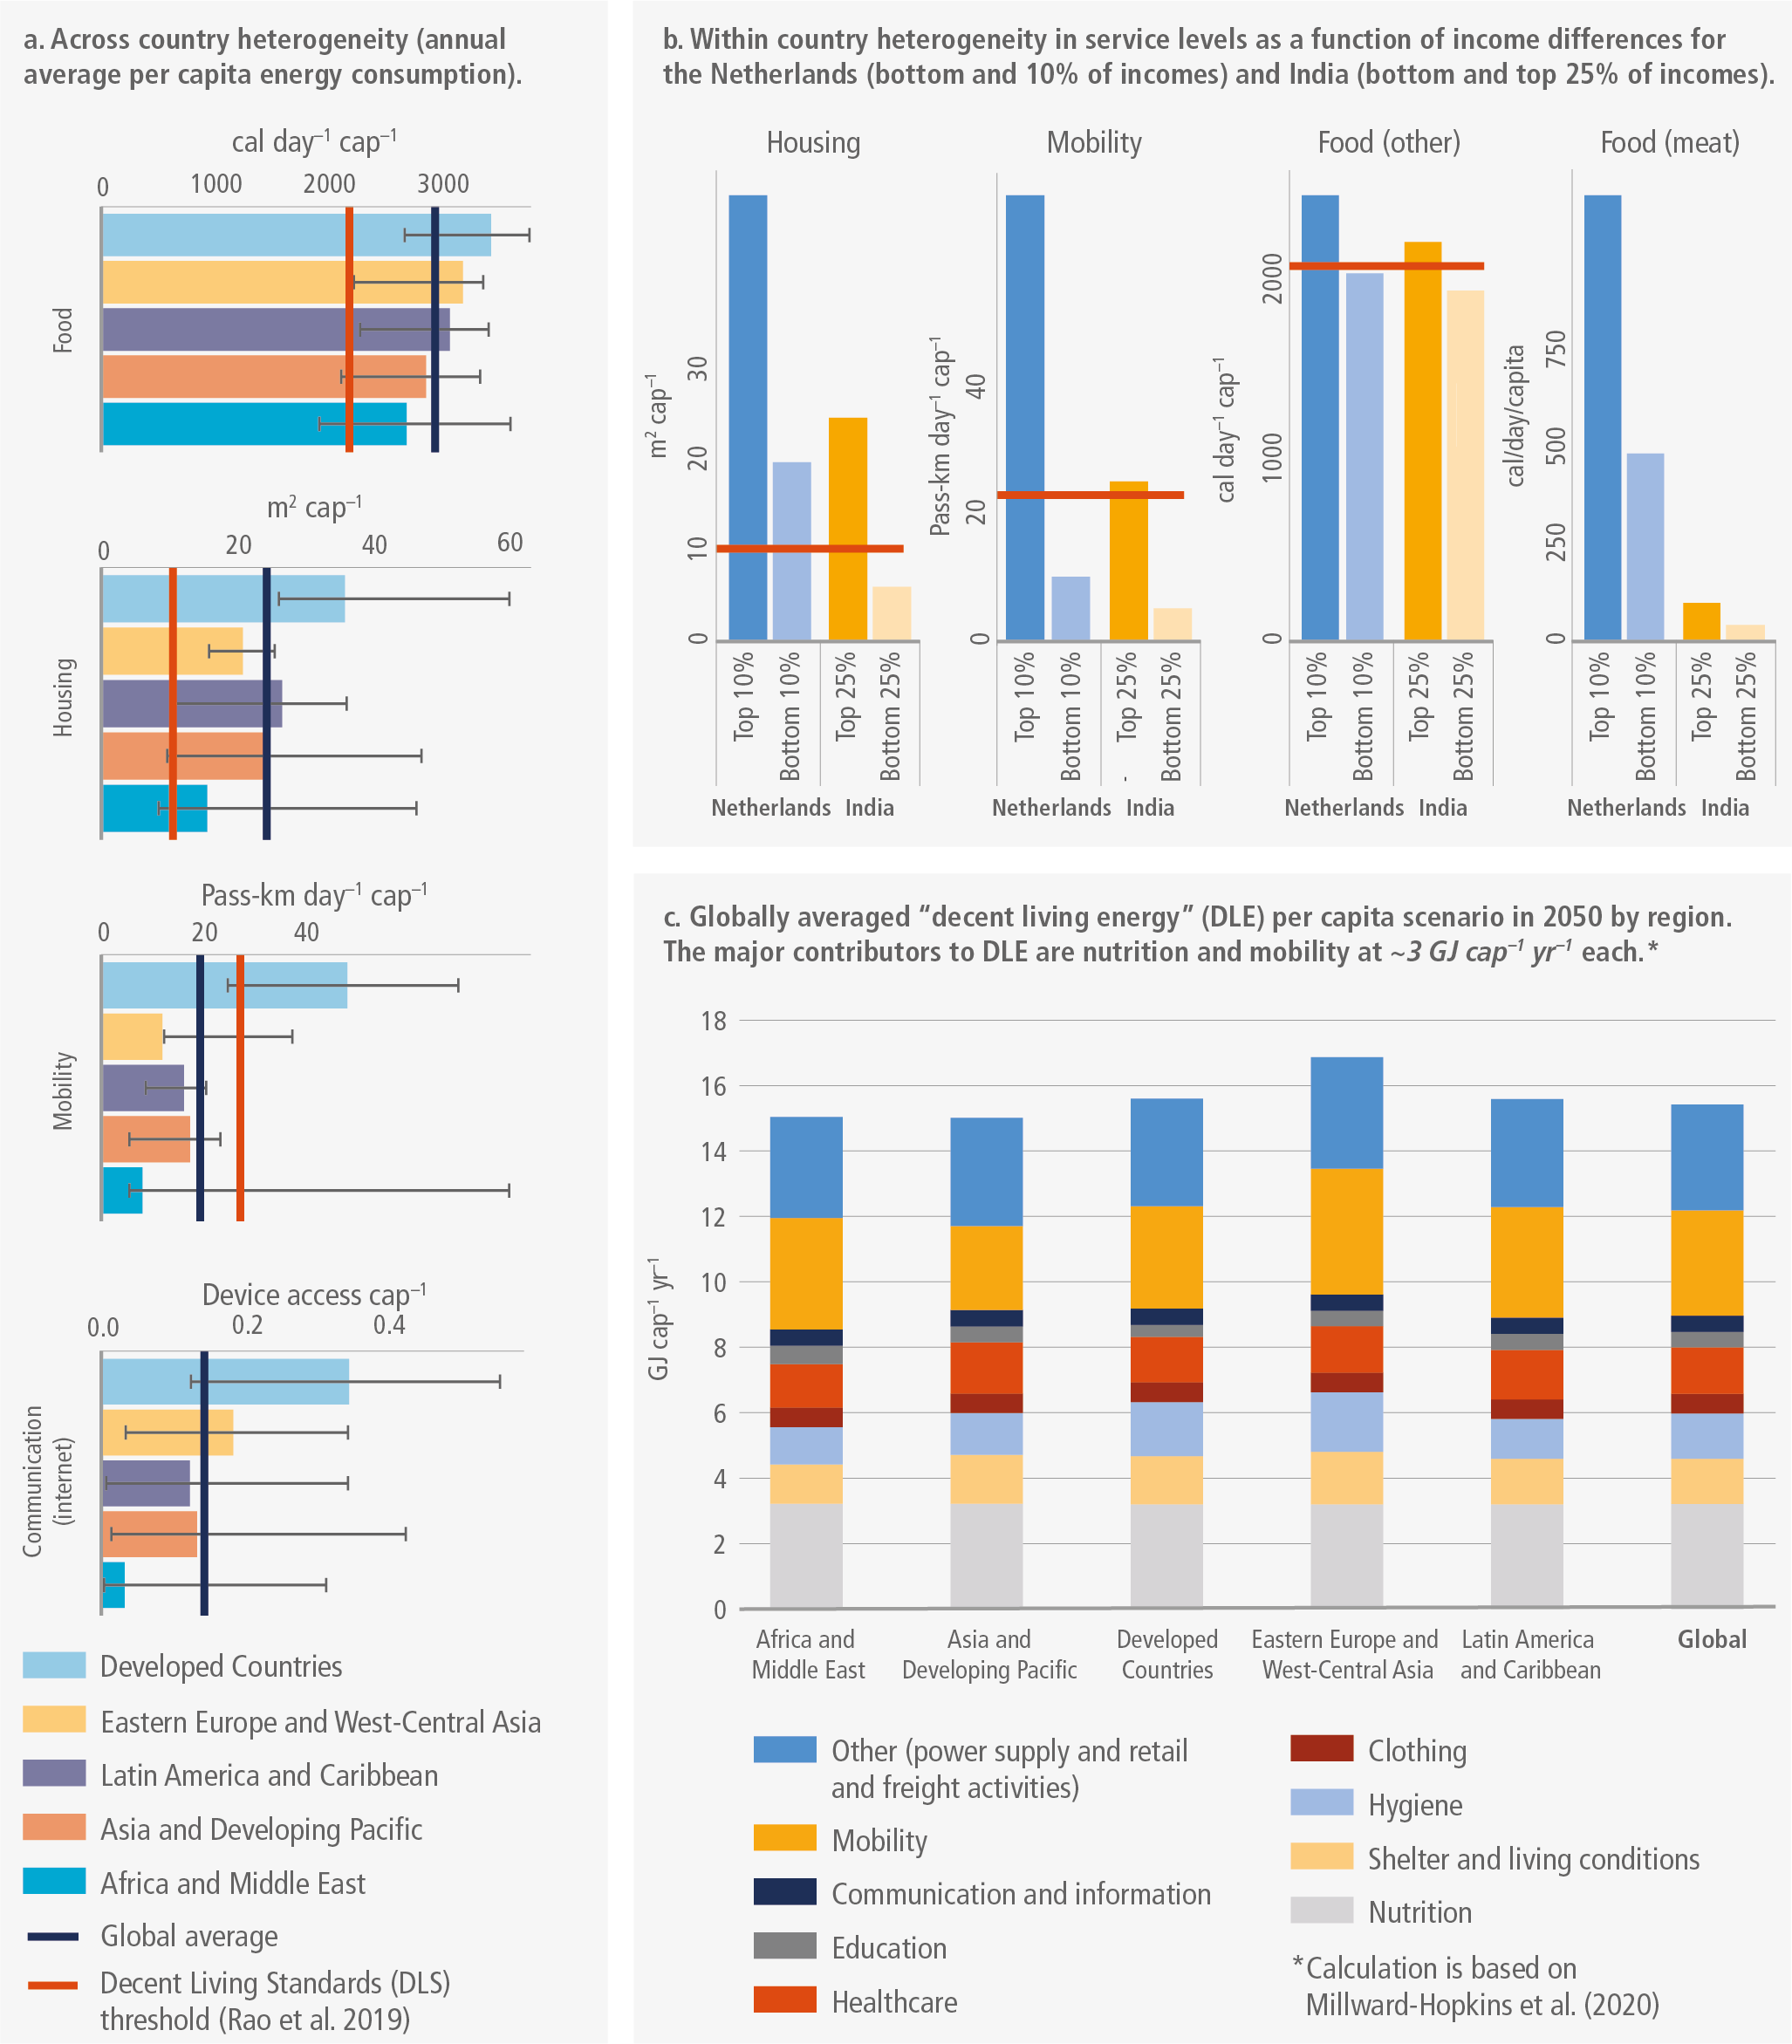
Figure caption
Figure 5.22 | Heterogeneity in access to and availability of services for human well-being within and across countries. Panel (a) Across-country differences in panel (a) food (meat and other), (b) housing, (c) mobility, (d) communication (mobile phones and high-speed internet access). Variation in service levels across countries within a region is shown as error bars (black). Values proposed as decent standards of living threshold (Rao et al. 2019b) are shown as red dashed lines. Global average values are shown as blue dashed lines. Panel (b) Within-country differences in service levels as a function of income differences for the Netherlands (bottom and top 10% of incomes) and India (bottom and top 25% of incomes) (Grubler et al. 2012b) (data update 2016). Panel (c) Decent living energy (DLE) scenario using global, regional and DLS dimensions for final energy consumption at 149 EJ (15.3 GJ cap–1 yr –1) in 2050 (Millward-Hopkins et al. 2020), requiring advanced technologies in all sectors and radical demand-side changes. Values are shown for five world regions based on the AR6 WGIII Regional breakdown. We use passenger kilometres per day per capita (km day–1 cap–1) as a metric for mobility only as a reference, however, transport and social inclusion research suggest the aim is to maximise accessibility and not travel levels or travelled distance.