Back to chapter figures
Figure 5.3
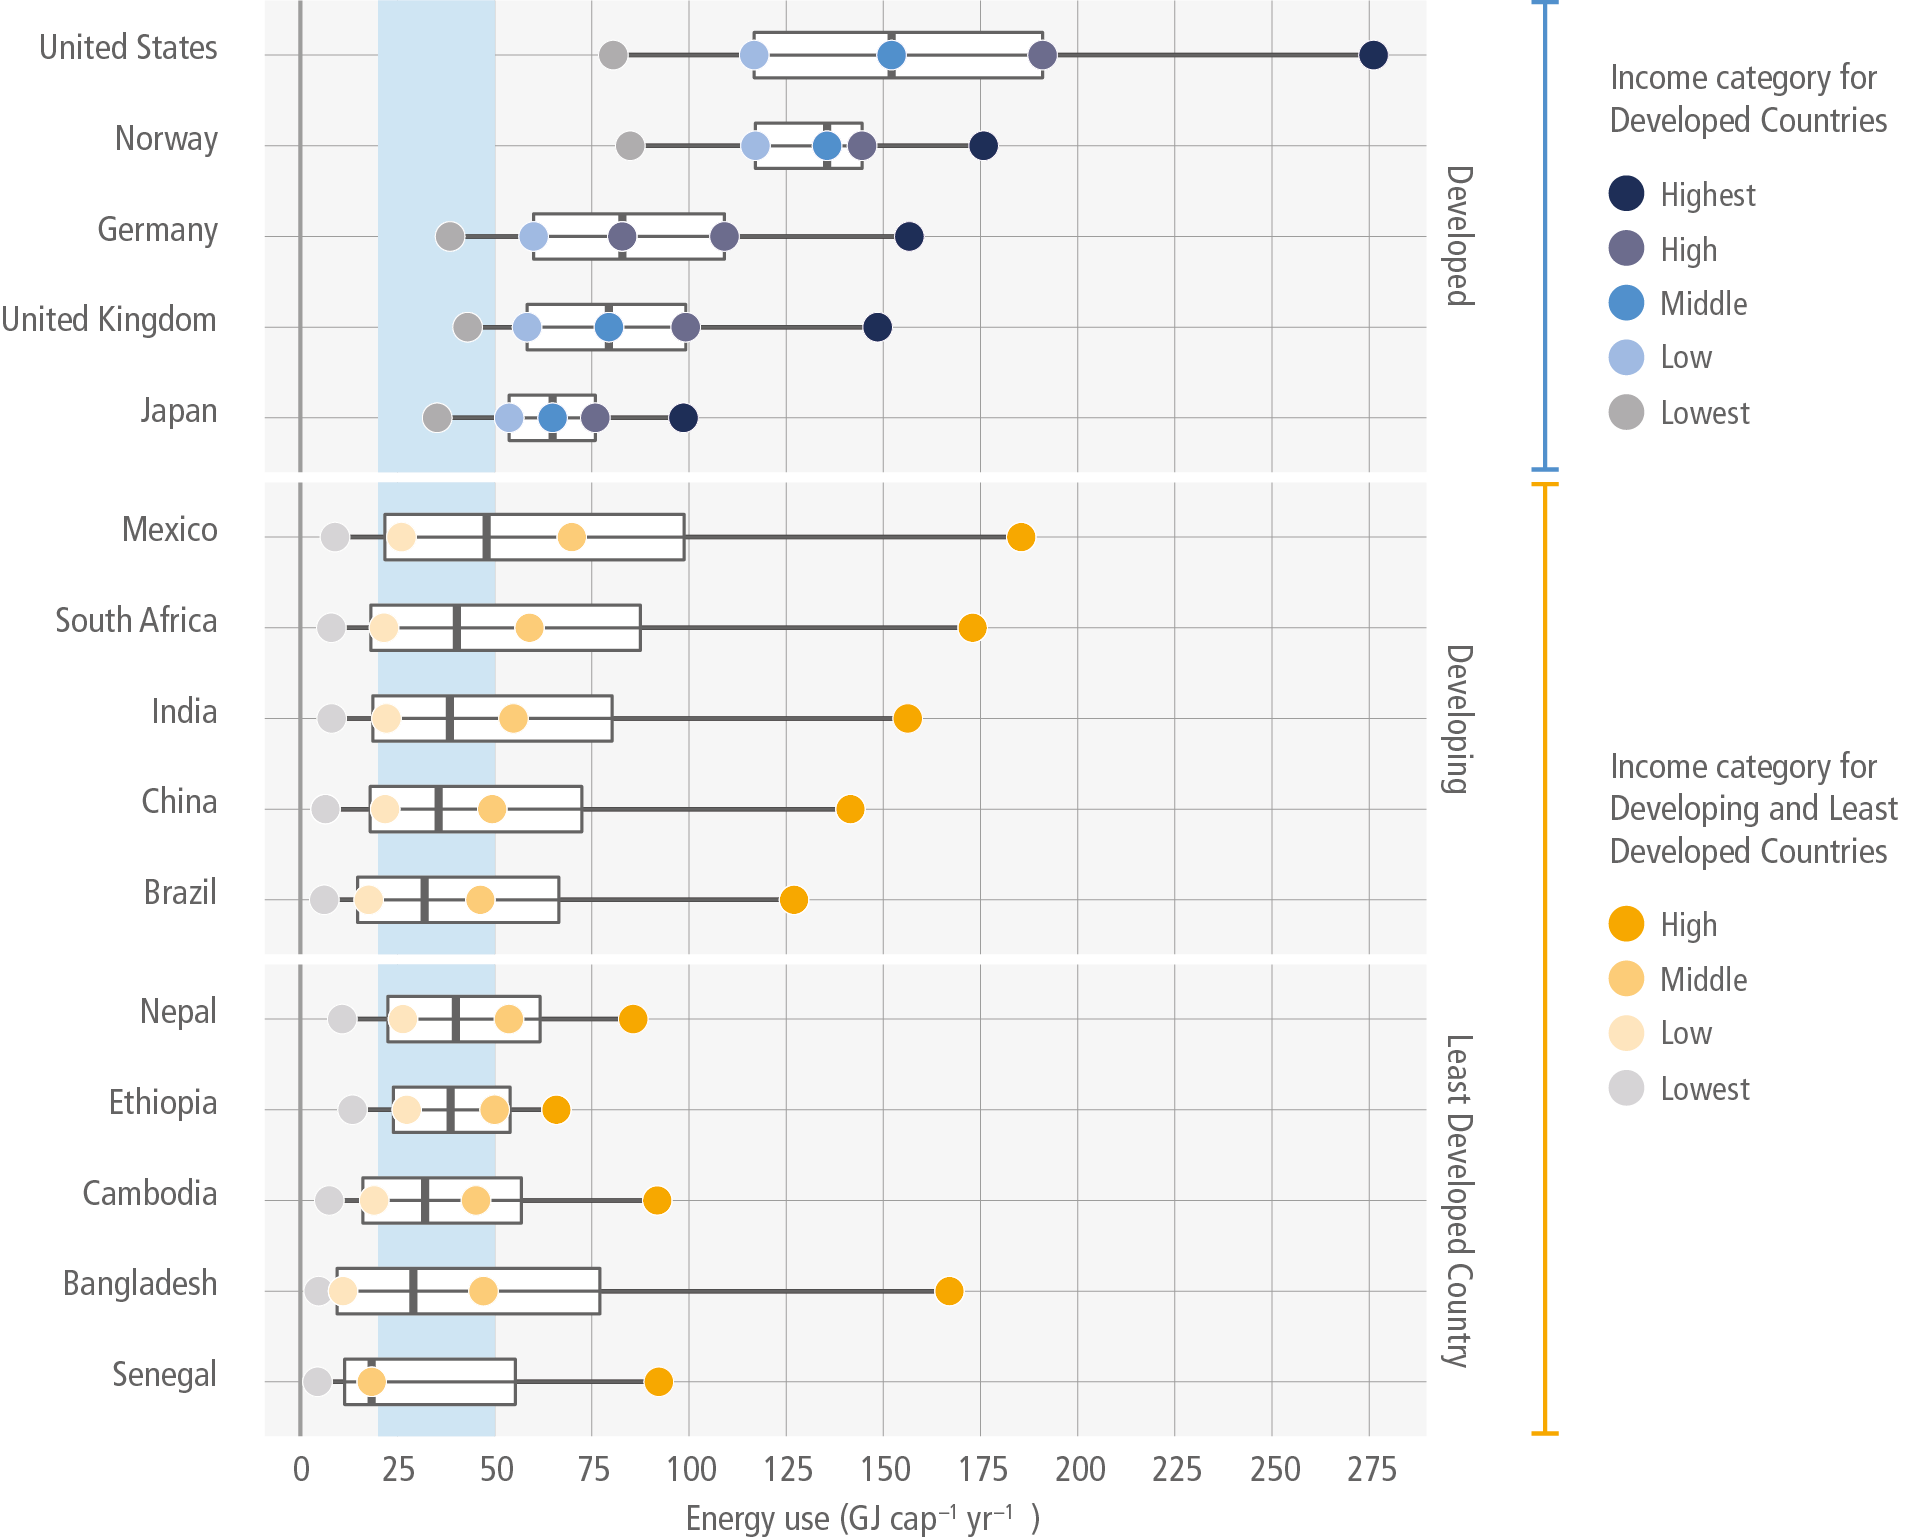
Figure caption
Figure 5.3 | Energy use per capita per year of three groups of countries ranked by socio-economic development and displayed for each country based on four or five different income groups (according to data availability) as well as geographical representation. The final energy use for decent living standards (20–50 GJ cap–1 yr –1) (Rao et al. 2019b) is indicated in the blue column as a reference for global range, rather than dependent on each country. Source: data based on Oswald et al. (2020).