Back to chapter figures
Figure 5.9
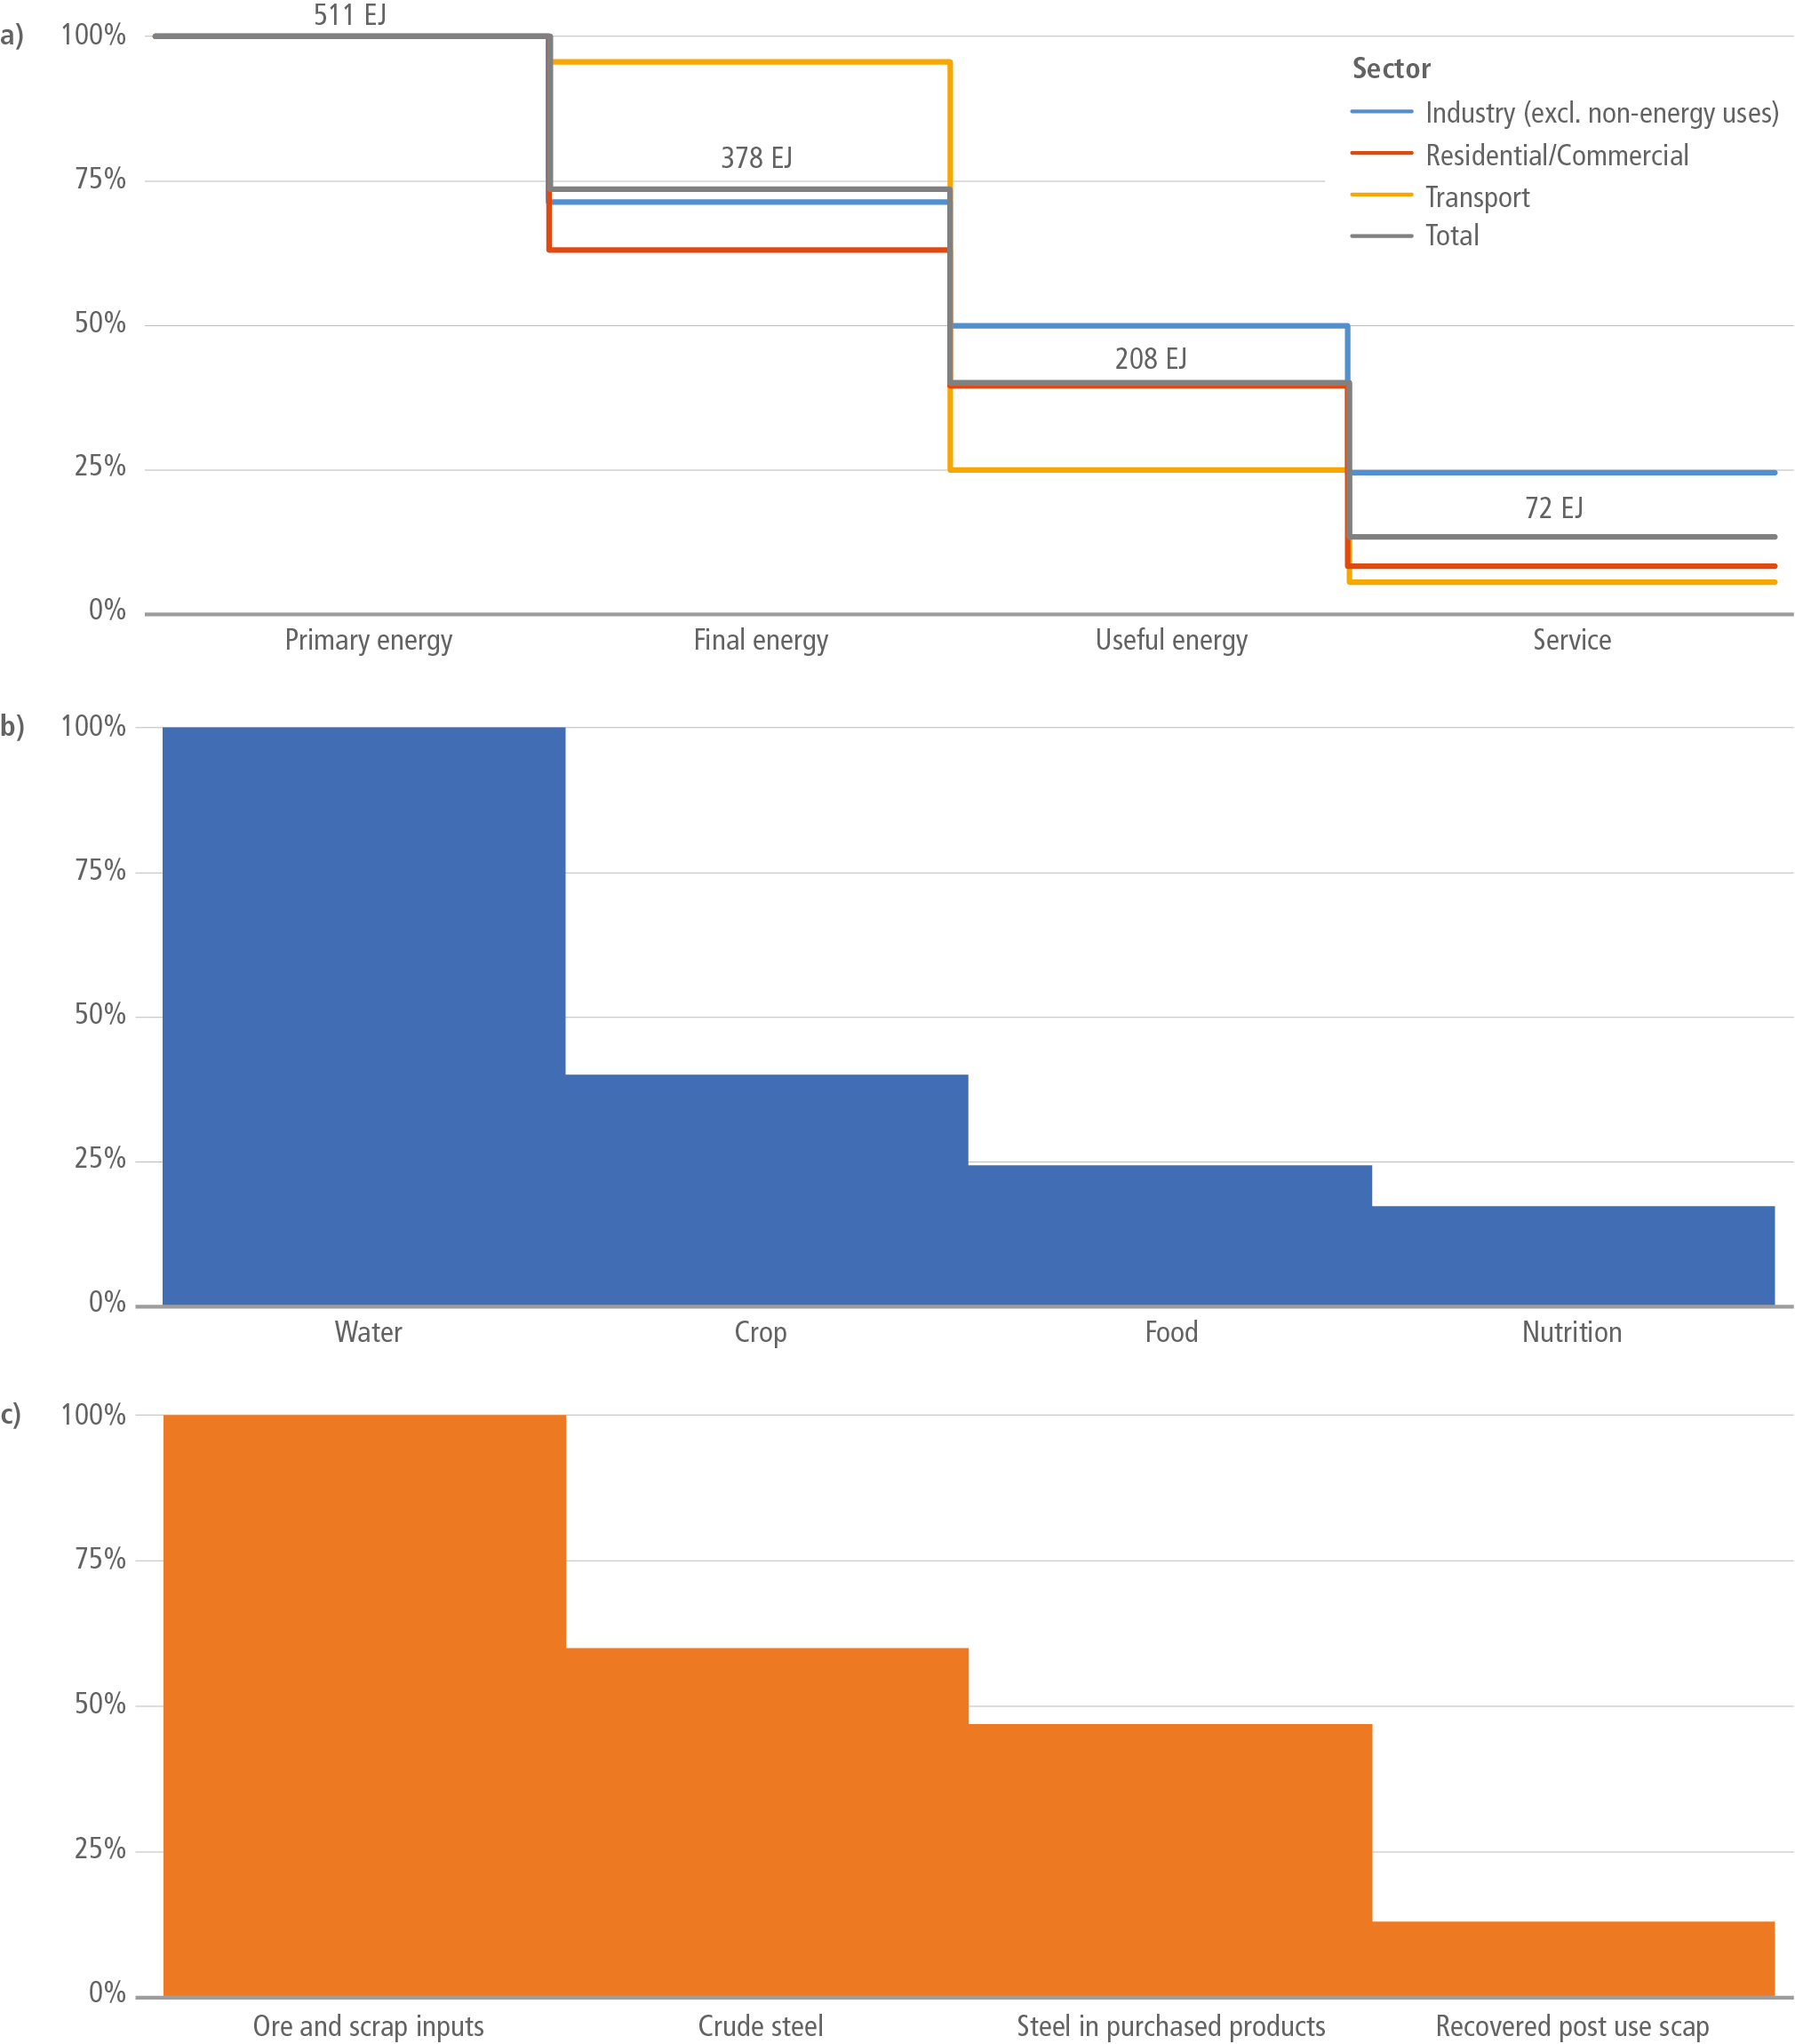
Figure caption
Figure 5.9 | Resource processing steps and efficiency cascades (in percentage of primary resource inputs [vertical axis] remaining at respective steps until ultimate service delivery) for illustrative global service delivery systems for energy (panel (a), disaggregated into three sectoral service types and the aggregate total), food (panel (b), water use in agriculture and food processing, delivery and use), and materials (panel (c), example steel). The aggregate efficiencies of service delivery chains is with 13–17% low. Source: TWI2050 (2018).