Back to chapter figures
Figure 6.11
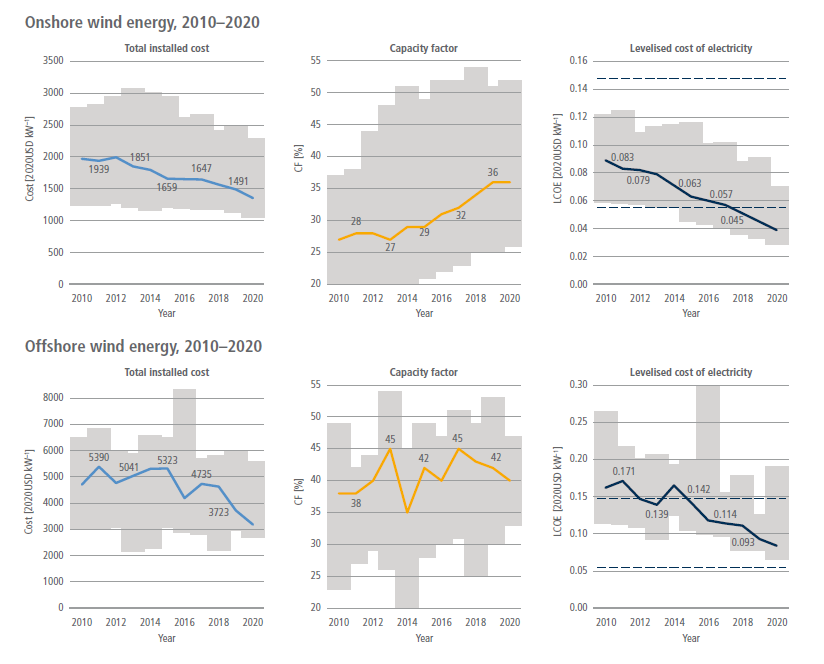
Figure caption
Figure 6.11 | Global weighted average total installed costs, capacity factors, and LCOE for onshore (top) and offshore (bottom) wind power of existing power plants per year (2010–2020). The shaded area represents the 5th and 95th percentiles, and the red dashed line represents the fossil fuel cost range. Source: with permission from IRENA (2021a).