IPCC Sixth Assessment ReportWorking Group III: Mitigation of Climate Change
About
Report
Resources
Download
Back to chapter figures

Figure 6.12

Figure caption

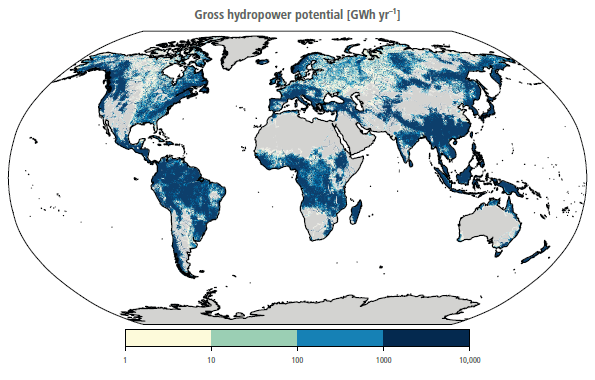
Figure 6.12 | Global map of gross hydropower potential distribution [GWh yr –1]. Source: data from Hoes et al. (2017).