Figure 6.18
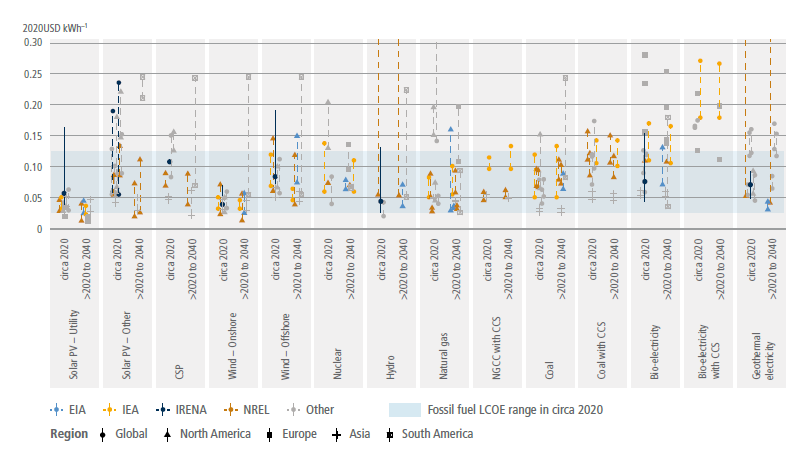
Figure caption
Figure 6.18 | Range of LCOE (in USD kWh–1) from recent studies for different electricity-generating technologies circa 2020 and in the future between 2020–2040. LCOEs are primarily taken from recent studies, because the costs of some technologies are changing rapidly. To make the figure more tractable across the studies, we highlight the data from IEA WEO 2020 STEPS scenario in yellow (IEA 2020), the EIA AEO 2021 in light blue (EIA 2021), NREL ATB 2021 in brown, (NREL 2021), and IRENA’s 2020 Renewable Power Generation Costs in dark blue (IRENA 2021). All other studies are shown in light grey markers. Marker shapes identify the regions included in the studies. Studies that included several regions are labelled as global. Only sources that provided LCOEs are included. Ranges for studies frequently reflect variations among regional estimates. Studies that are shown as a mid-point and a solid line represent studies that reported either a median or an average, and that had either a confidence interval or a minimum and a maximum reported. Dashed lines with markers at the end represent the range of values reported in studies that had several point estimates for either different regions or used different assumptions. All estimates were converted to USD2020. The publication year was used if no USD year was provided. Some studies included transmissions costs, and some of the CCS studies included storage and sequestration costs, while others did not. Vertical axis is capped at USD2020 0.30 kWh–1, but some estimates for hydro, geothermal, natural gas and bioelectricity were higher than 0.30. The grey horizontal band denotes the range of fossil fuel electricity LCOEs circa 2020.