Back to chapter figures
Figure 6.25
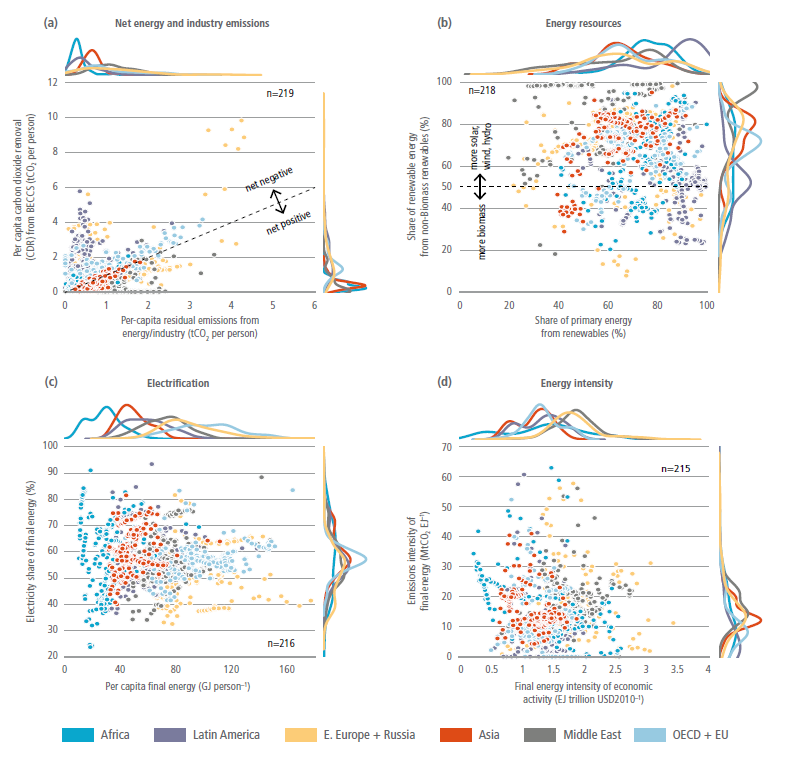
Figure caption
Figure 6.25 | Characteristics of regional energy systems and emissions when global energy and industrial CO2 emissions reach net-zero. Regional differences are shown for: (a) residual emissions and carbon removal; (b) energy resources; (c) electrification; and (d) energy intensity. Distributions of scenarios are shown along each axis for each region. Colour scheme is shown in (a). Points represent individual scenarios from the AR6 Scenarios Database (R6 regions dataset).