Back to chapter figures
Figure 6.32
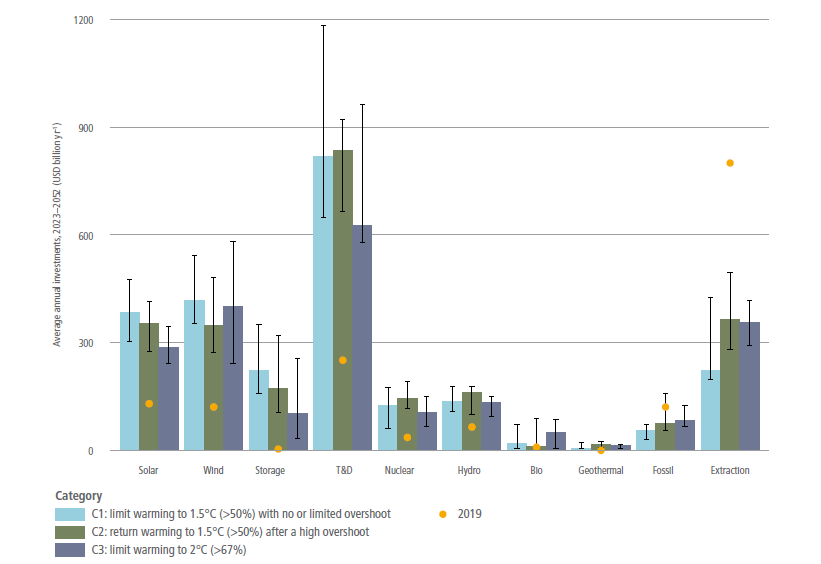
Figure caption
Figure 6.32 | Global average annual investments from 2023 to 2052 (undiscounted, in USD billion yr –1) for electricity supply sub-sectors and for extraction of fossil fuels in scenarios that limit warming to 2°C (>67%) or lower (C1-C3) (Source: AR6 Scenarios Database and Chapter 3). Historical investments are also shown for comparison (Source: IEA 2021; approximations are made for hydro and geothermal based on available data; solar and wind values are for 2020). T&D: transmission and distribution of electricity. Bars show median values across models-scenarios, and whiskers the interquartile ranges. See Chapters 3 and 15 for additional information on investments and finance.