Back to chapter figures
Figure 6.8
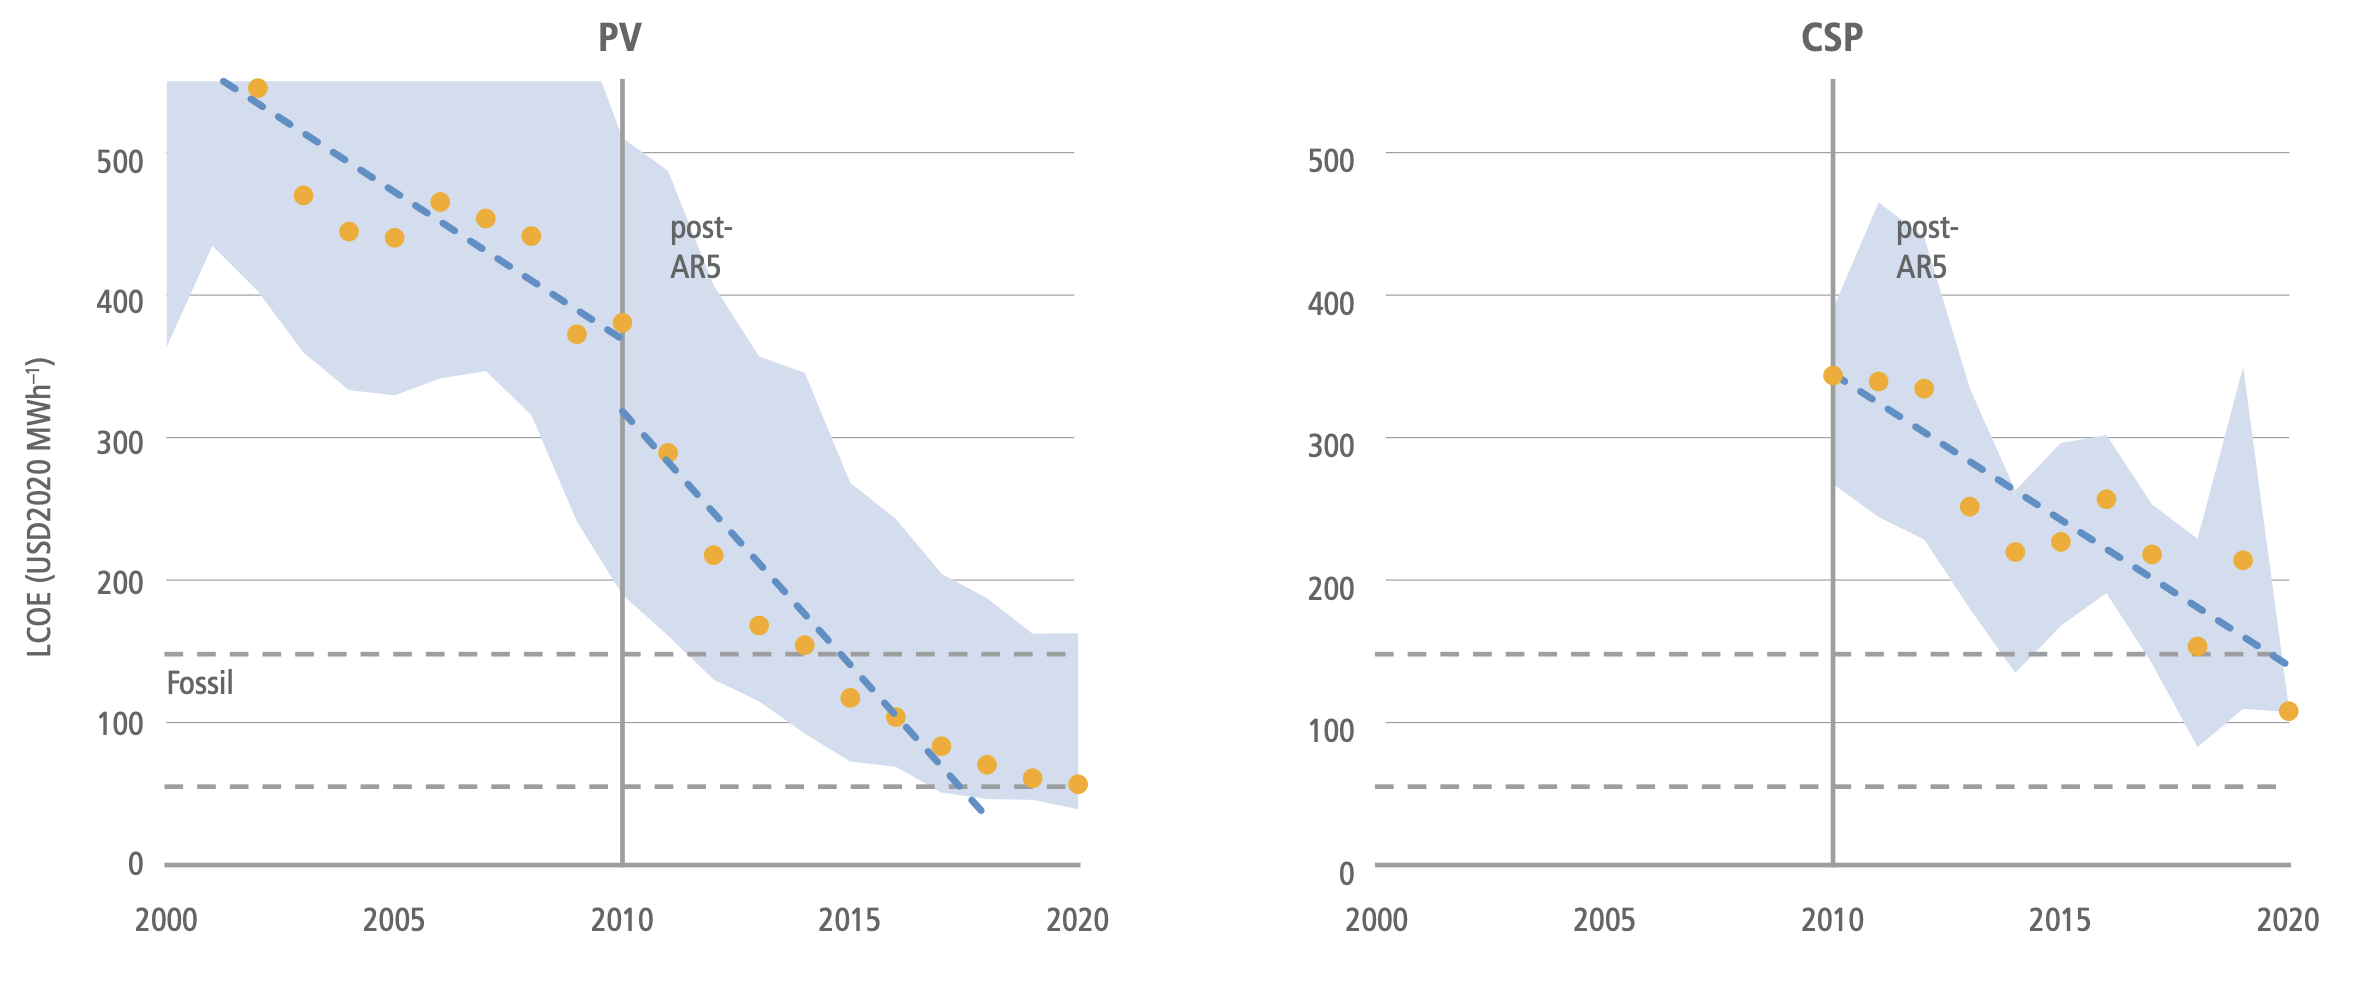
Figure caption
Figure 6.8 | Levelised costs of electricity (LCOE) of solar energy technologies 2000–2020. Range of fossil fuel LCOE indicated as dashed lines USD50–177 MWh–1. Linear fit lines were applied to data for AR4–AR5 and post-AR5 (2012). Yellow dots are capacity-weighted global averages for utility-scale installations. The blue area shows the range between the 5th and 95th percentile in each year. Data: IRENA (2021b).