Figure 7.12
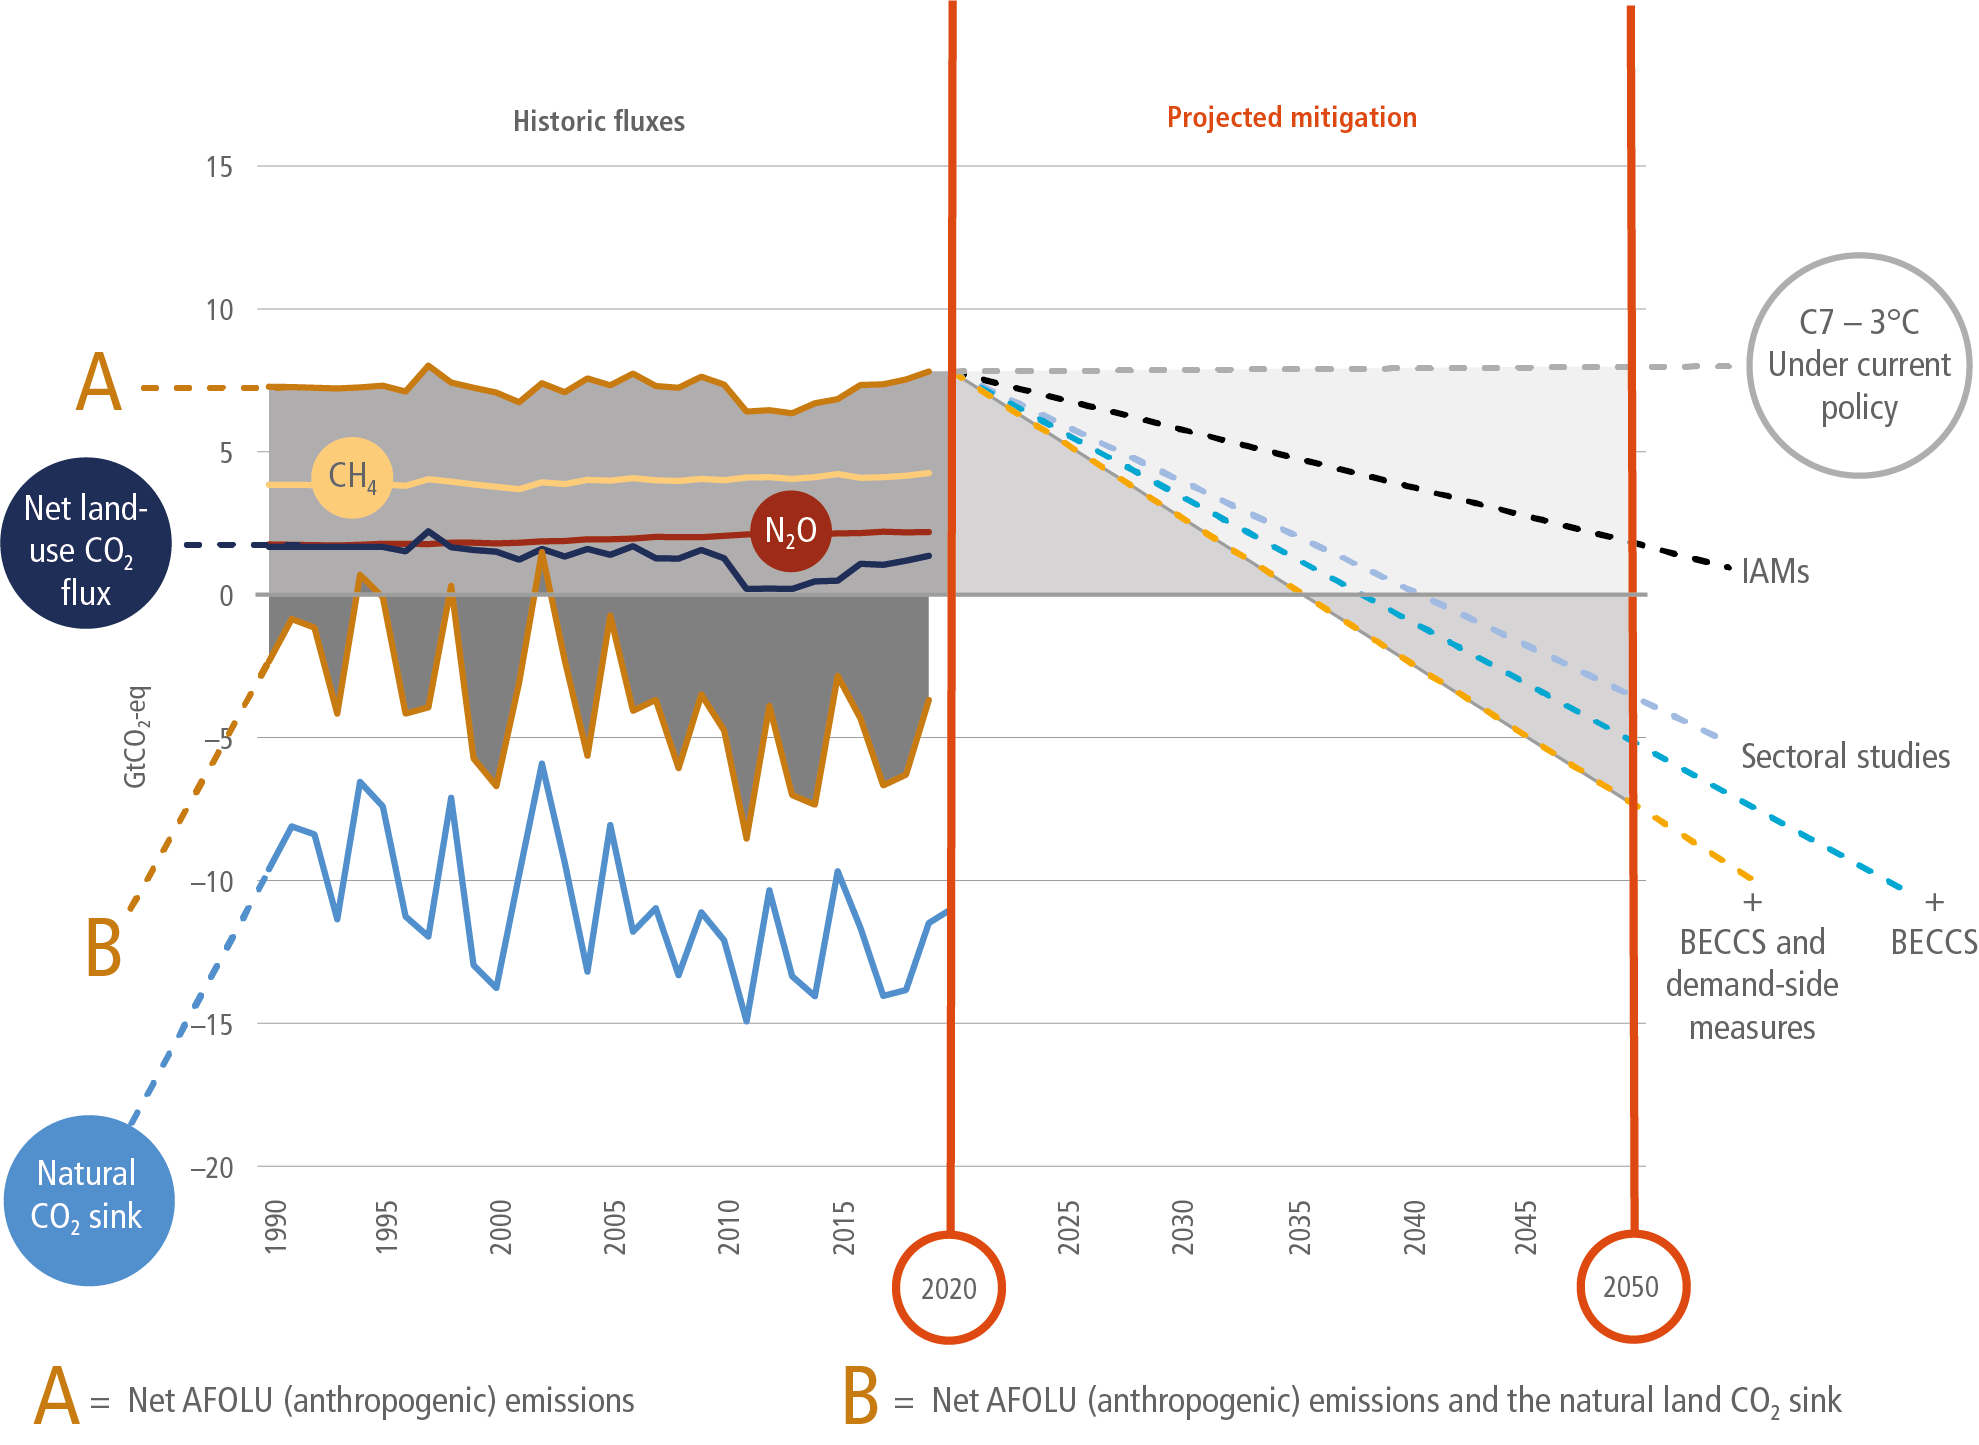
Figure caption
Figure 7.12 | Historic land sector GHG flux estimates and illustrative AFOLU mitigation pathways to 2050, based on data presented in Sections 7.2, 7.4 and 7.5. Historic trends consider both A anthropogenic (AFOLU) GHG fluxes (GtCO2-eq yr–1) according to FAOSTAT (FAO 2021a; 2021b) and B the estimated natural land CO2 sink according to (Friedlingstein et al. 2020). Note that for the anthropogenic net land CO2 flux component, several approaches and methods are described within the literature (Section 7.2.2) with a wide range in estimates. For clarity, only one dataset (FAOSTAT) is illustrated here. It is not intended to indicate preference for one particular method over others. Historic flux trends are illustrated to 2019, the latest year for which data is available. Projected economic mitigation potential (at costs of up to USD100 tCO2-eq–1) includes estimates from IAMs and sectoral studies (Table 7.3). The ‘sectoral studies’ are disaggregated into several cumulative parts: first ‘sectoral studies’ involves measures in agriculture, forests and other ecosystems, then an additional BECCS share (‘+ BECCS’), then the additional effect of demand-side measures and BECCS (‘+BECCS and demand-side measures’). The latter only accounting for diverted agricultural production to avoid double counting. Projected mitigation assumes adoption of measures to achieve increasing, linear mitigation, reaching average annual potential in 2050, although this does not reflect deployment rates for most measures. For illustrative purposes, a pathway to projected emissions in 2050 according to a scenario of current policy (C7 – above 3.0°C – Model: GCAM 5.3) is additionally included for reference.