Figure 7.13
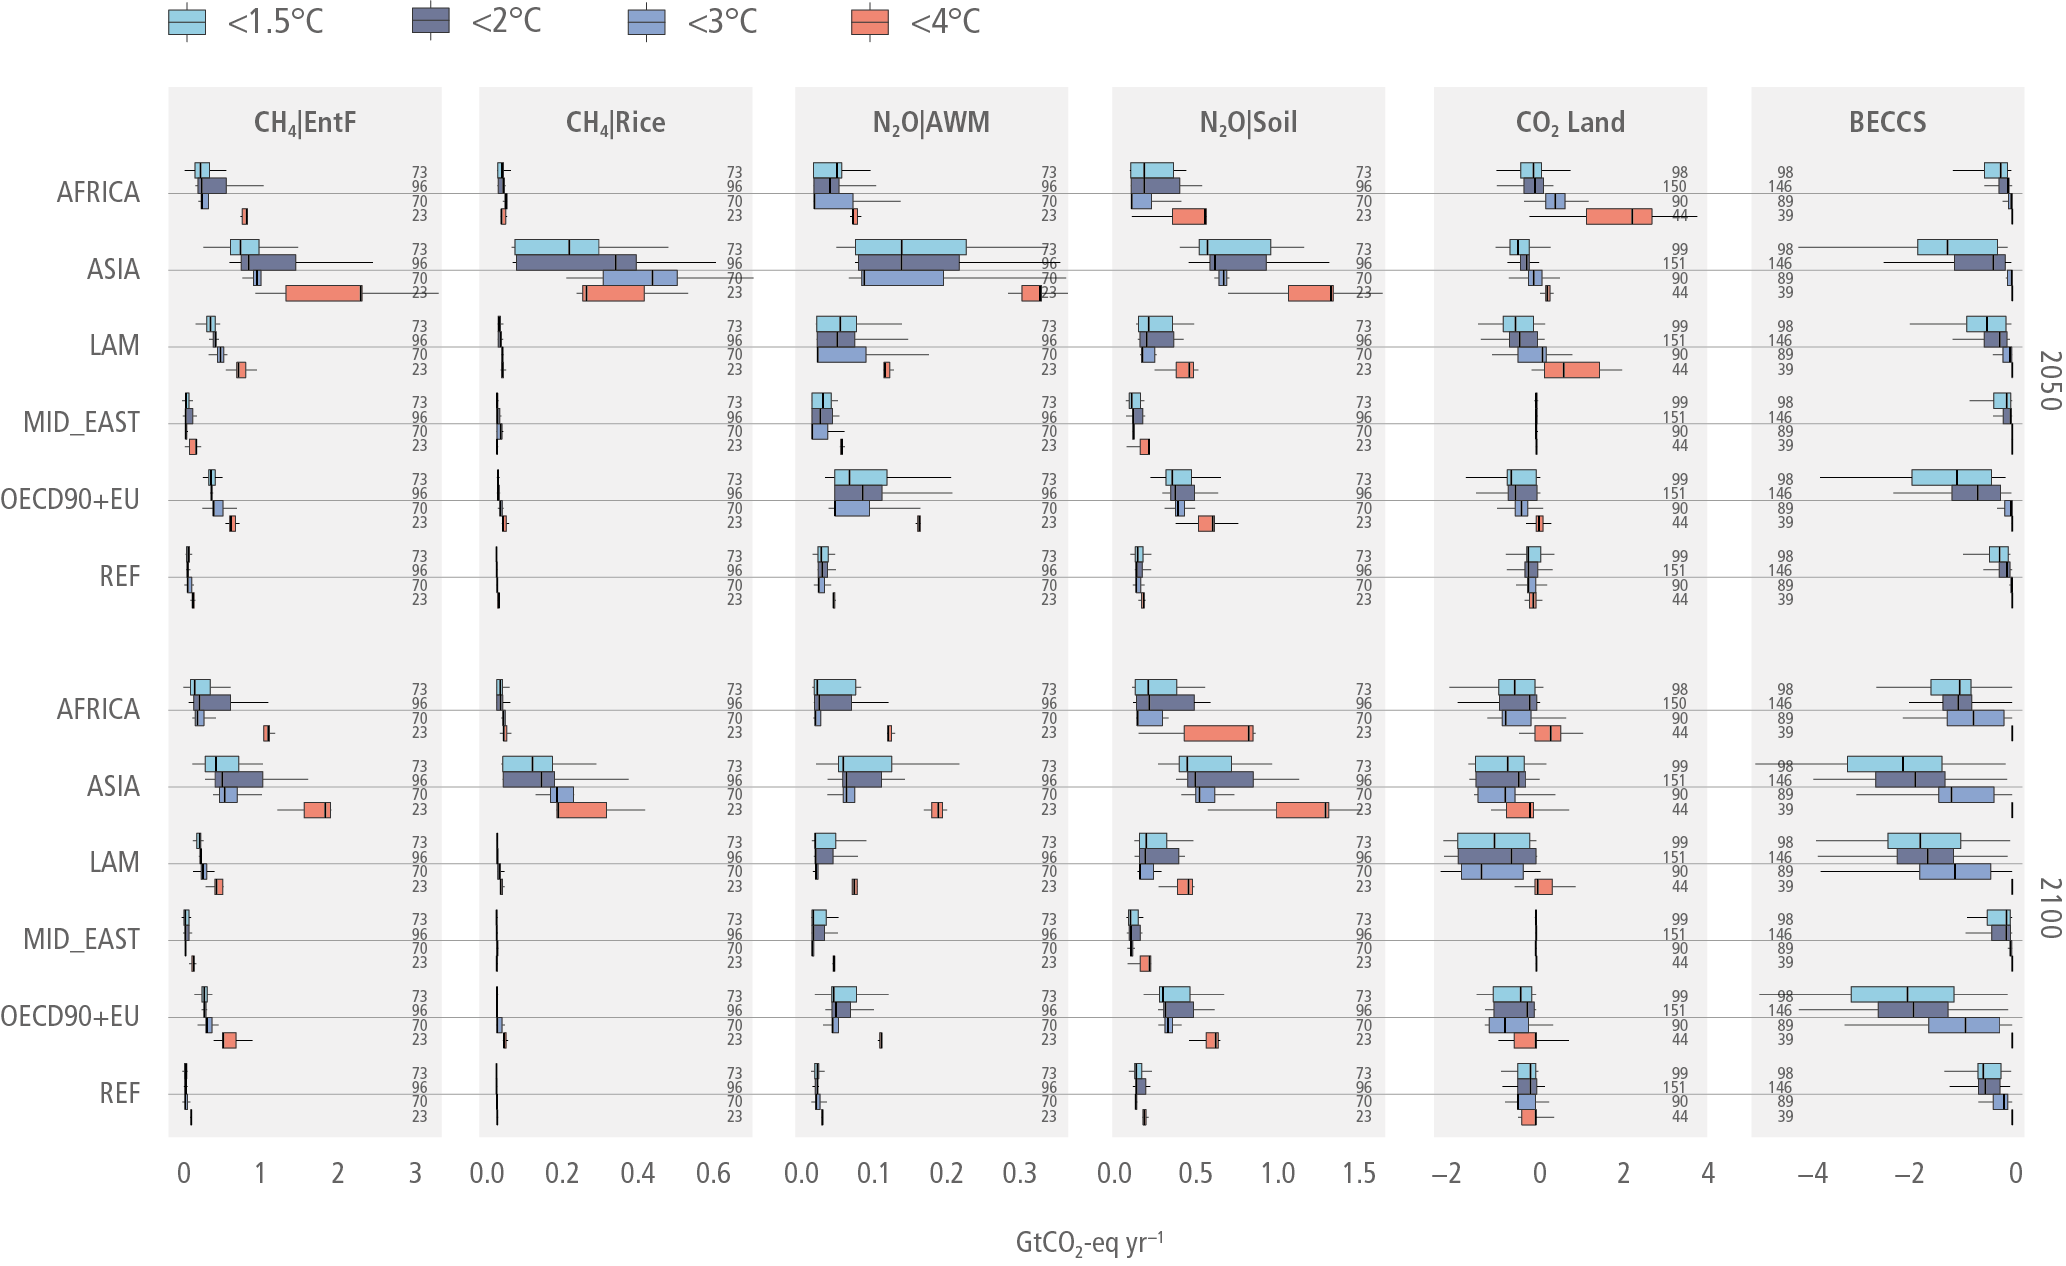
Figure caption
Figure 7.13 | Land-based regional GHG emissions and removals in 2050 (top) and 2100 (bottom) for scenarios from the AR6 Database with <1.5°C (C1, C2), <2°C (C3, C4), <3°C (C5, C6) and <4°C (C7) global warming in 2100 (scenario type is indicated by colour). The categories shown include CH4 emissions from enteric fermentation (EntF) and rice production (Rice), N2O emissions from animal waste management (AWM) and fertilisation (Soil). The category CO2 Land includes CO2 emissions from land-use change as well as removals due to afforestation/reforestation. BECCS reflects the CO2 emissions captured from bioenergy use and stored in geological deposits. The annual GHG emission data from various models and scenarios is converted to CO2 equivalents using GWP factors of 27 for CH4 and 273 for N2O. The data is summarised in boxplots (Tukey style), which show the median (vertical line), the interquartile range (IQR box) and the range of values within 1.5 × interquartile range at either end of the box (horizontal lines) across all models and scenarios. The number of data points available for each emission category, scenario type, region and year is shown at the edge of each panel. Regional definitions: AFRICA = sub-Saharan Africa, ASIA = Asia, LAM = Latin America and Caribbean, MID_EAST = Middle East, OECD90+EU = OECD 90 and EU, REF = Reforming Economies of Eastern Europe and the Former Soviet Union.