Figure 7.14
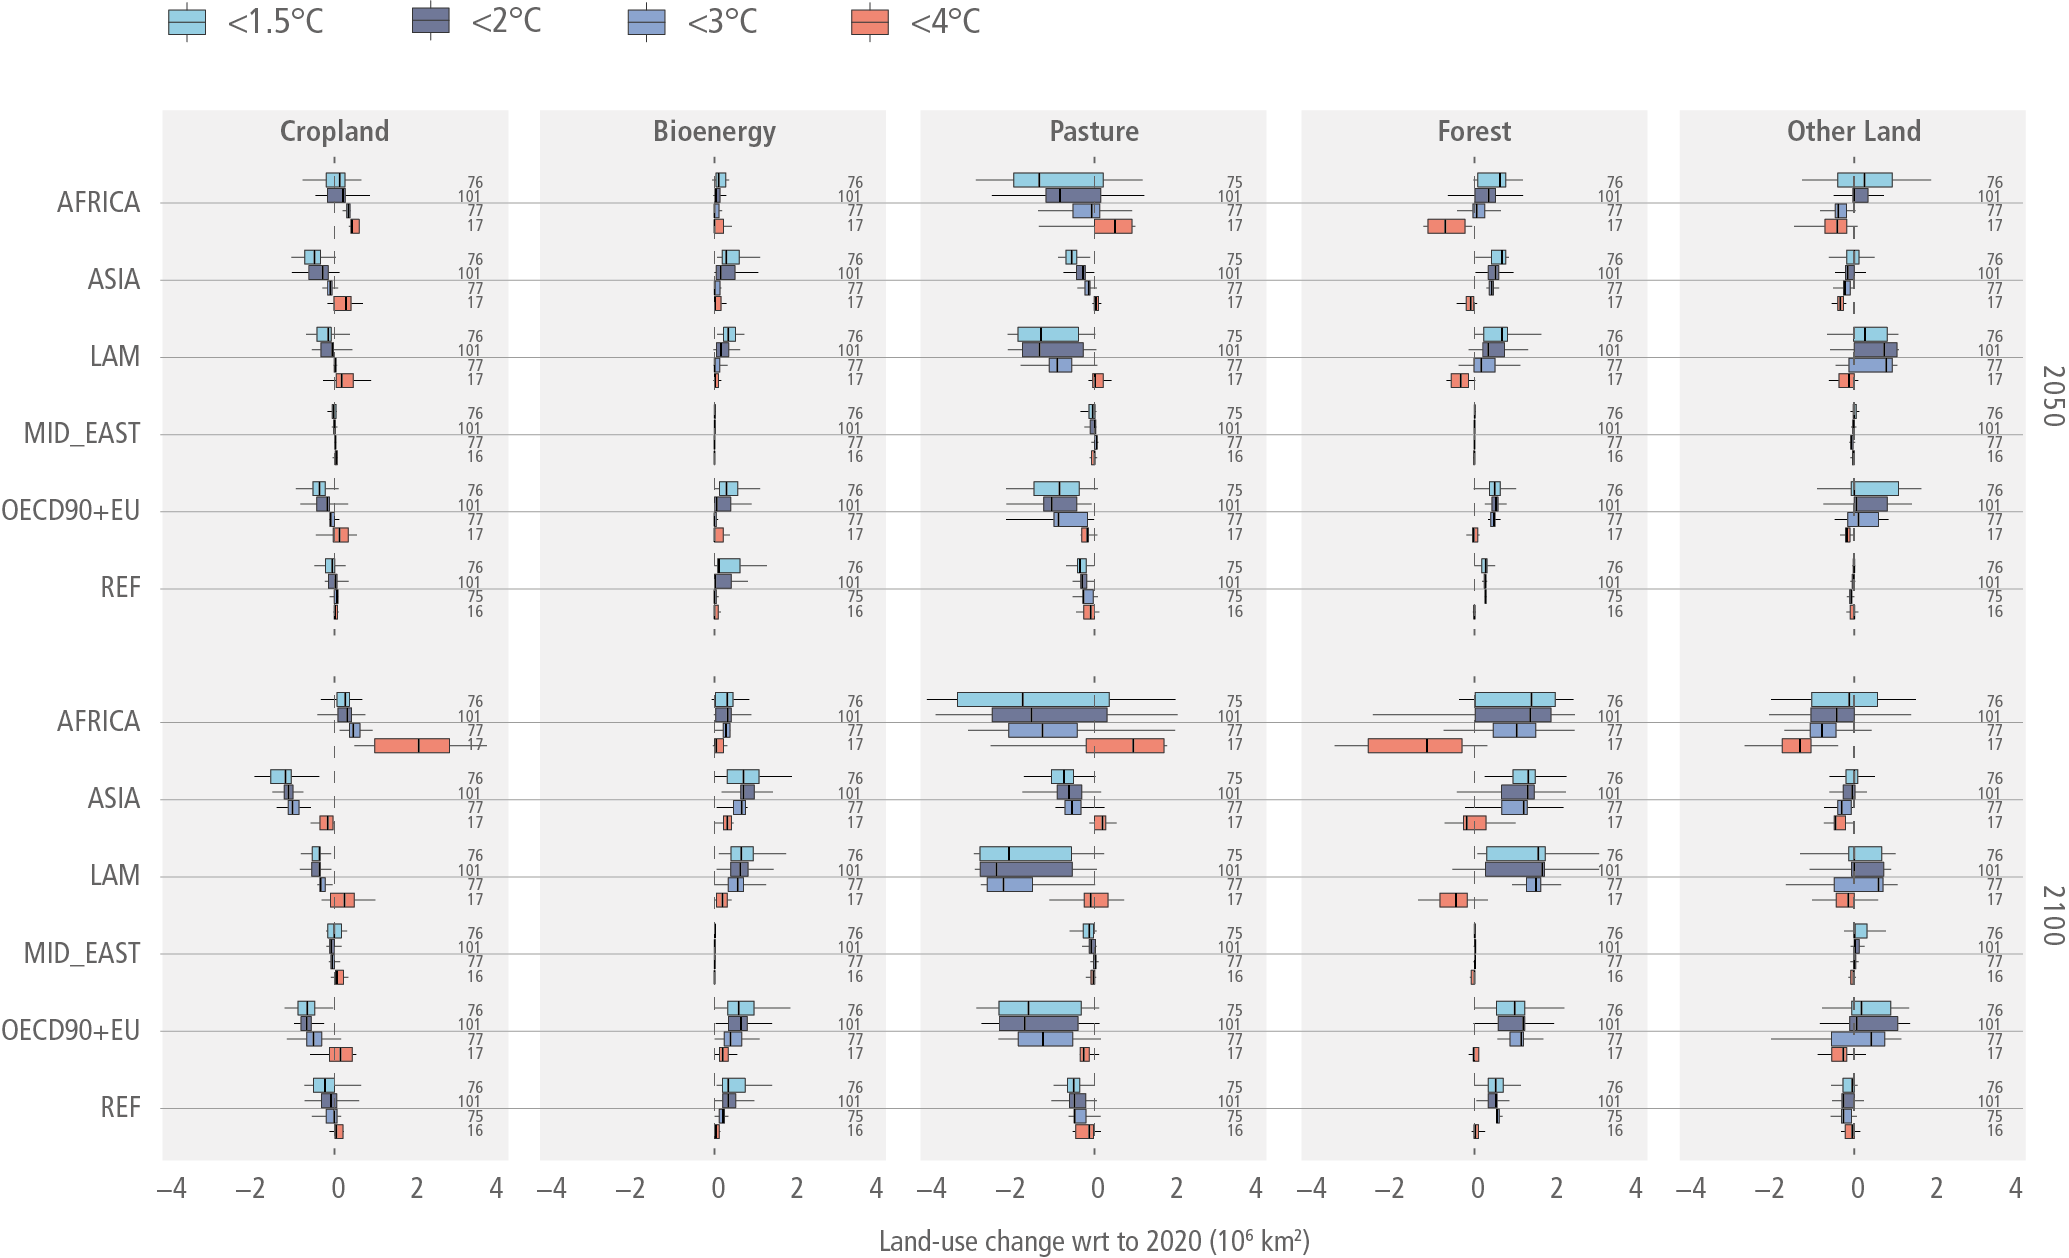
Figure caption
Figure 7.14 | Regional change of major land cover types by 2050 (top) and 2100 (bottom) relative to 2020 for scenarios from the AR6 Database with <1.5°C (C1, C2), <2°C (C3, C4), <3°C (C5, C6) and <4°C (C7) global warming in 2100 (scenario type is indicated by colour). The data is summarised in boxplots (Tukey style), which show the median (vertical line), the interquartile range (IQR box) and the range of values within 1.5 × IQR at either end of the box (horizontal lines) across all models and scenarios. The number of data points available for each land cover type, scenario type, region and year is shown at the right edge of each panel. Regional definitions: AFRICA = sub-Saharan Africa, ASIA = Asia, LAM = Latin America and Caribbean, MID_EAST = Middle East, OECD90+EU = OECD 90 and EU, REF = Reforming Economies of Eastern Europe and the Former Soviet Union.