Figure 7.15
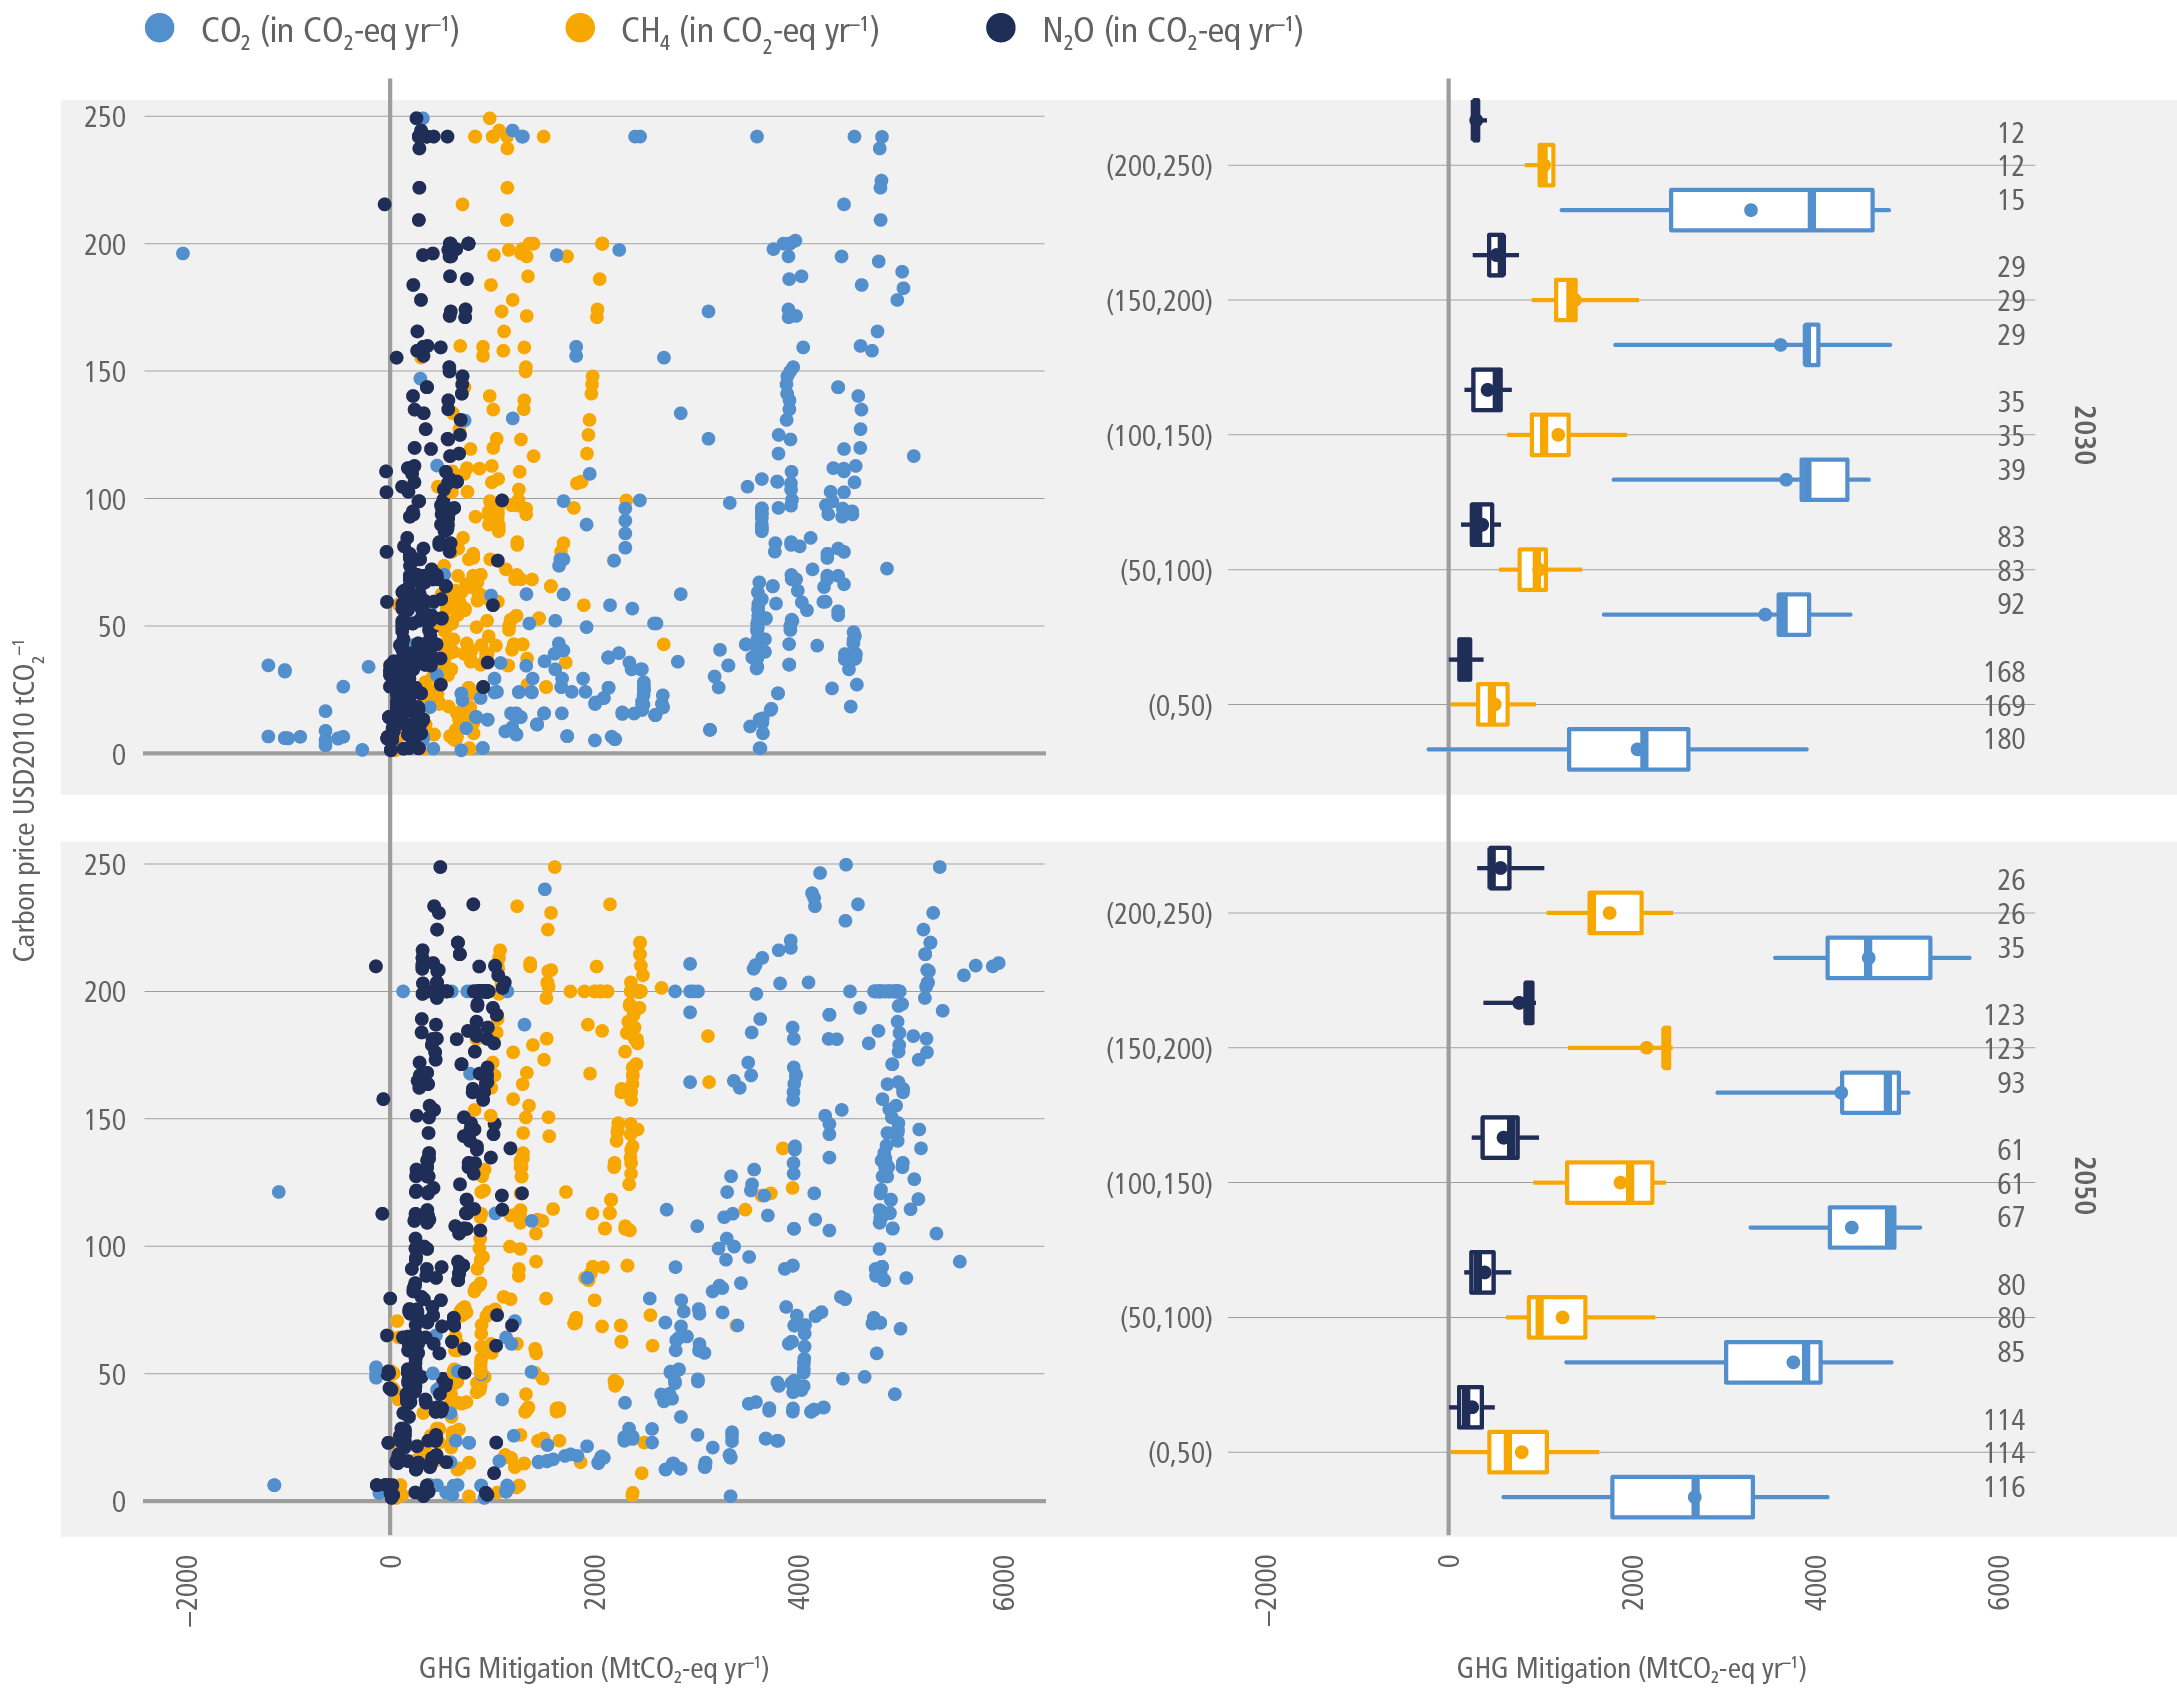
Figure caption
Figure 7.15 | Mitigation of CO2, CH4 and N2O emissions (in CO2-eq yr–1 using IPCC AR6 GWP100 values) from the AFOLU sector for increasing carbon price levels for 2030 and 2050. In the left-hand panels, single data points are generated by comparing emissions between a policy scenario and a related benchmark scenario, and mapping these differences with the respective carbon price difference. Plots only show the price range of up to 250 USD2010 tCO2-eq–1 and the mitigation range between –2000 and 6000 MtCO2-eq yr–1 for better visibility. At the right-hand side, based on the same data as left-hand side panels, boxplots show medians (vertical line within the boxes), means (dots), 33%–66% intervals (box) and 10%–90% intervals (horizontal lines). Numbers on the very right indicate the number of observations falling into the respective price range per variable. A wide range of carbon price induced mitigation options (such as technical, structural and behavioural options in the agricultural sector, afforestation, reforestation, natural re-growth or avoided deforestation in the LULUCF sector, excluding carbon capture and sequestration from BECCS) are reflected in different scenarios.