Figure 7.3
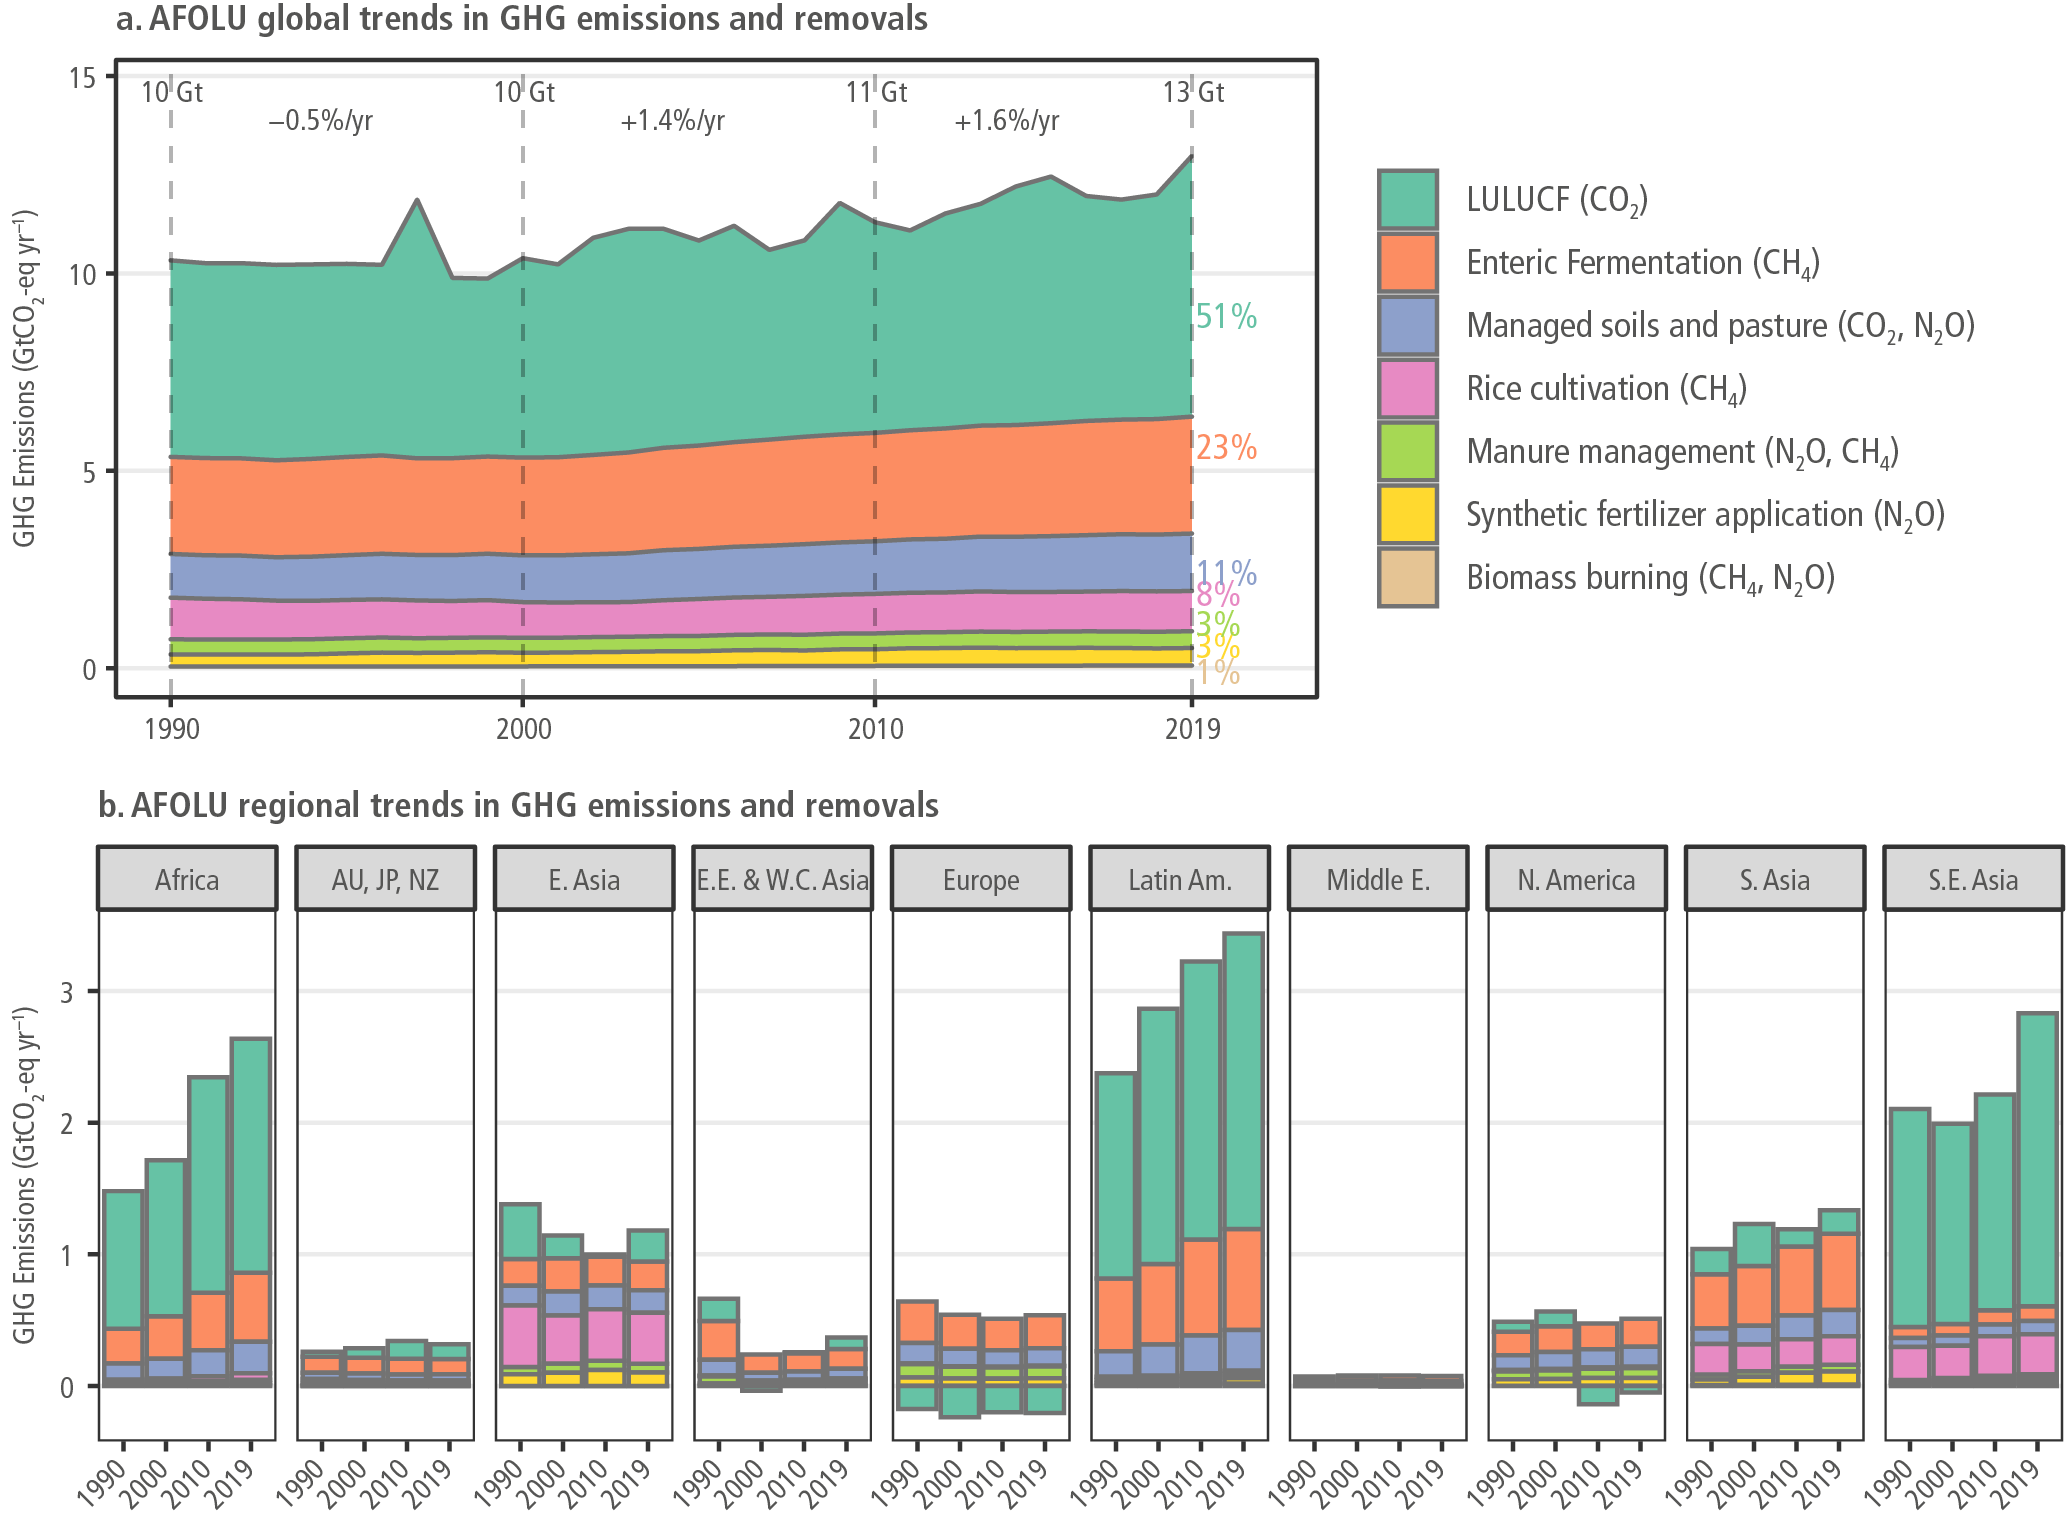
Figure caption
Figure 7.3 | Subdivision of the total AFOLU emissions from Table 7.1 by activity and gas for the period 1990 to 2019. Positive values are emissions from land to atmosphere, negative values are removals. Panel A shows emissions divided into major activity and gases. Note that ‘biomass burning’ is only the burning of agriculture residues in the fields. The indicated growth rates between 1990–2000, 2000–2010, 2010–2019 are annualised across each time period. Panel B illustrates regional emissions in the years 1990, 2000, 2010, 2019 AFOLU CO2 (green shading) represents all AFOLU CO2 emissions. It is the mean from three bookkeeping models (Hansis et al. 2015; Houghton and Nassikas 2017; Gasser et al. 2020) as presented in the Global Carbon Budget (Friedlingstein et al. 2020) and is not directly comparable to LULUCF in NGHGIs (Section 7.2.2). Data on CH4 and N2O emissions are from the EDGAR database (Crippa et al. 2021). See Sections 7.2.2 and 7.2.3 for comparison of different datasets. All values expressed are as CO2-eq with GWP100 values: CH4 = 27, N2O = 273.